Point Source Noise Estimation From PROPHOT Uncertanties
Introduction
Chas Beichman suggested that the distribution of uncertainties quoted for the point source photometry from PROPHOT can be used to estimate the effective point source noise in a 2MASS survey scan. This noise level can then be used to define the signal-to-noise threshold for detections to be included in the incremental release catalog. The advantage of such an estimator is that is intimately tied to the photometry algorithms, and it can be calculated easily from source listings in the database, so will not require time-consuming restoration of processed data from tape.
This suggestion is based on the assumption that the measurement uncertainty returned by the PROPHOT profile-fitting routines accurately samples the true photometric noise distribution. The PROPHOT uncertainty incorporates the photon noise in the local background (sky) and the photon noise in the source, as well as the accuracy to which the profile of the source matches the template of a true points source. A number of effects will increase the uncertainty measured for individual objects such as source crowding, background variations, both astrophysical and atmospheric, seeing fluctuations, etc. These effects should produce a tail to higher flux levels in the error distribution, but there should be an identifiable mode that characterizes the true point source noise distribution in the scan.
PROPHOT Flux Error Distrbutions
Figures 1 through 3 below show plots of the flux uncertainty reported by the profile-fitting photometry as a function of source flux density for non-artifact R2-R1 sources in three sample 2MASS scans that span a broad range of source density. For the analysis described in this report, magnitude-to-flux conversions were made using flux-for-zero magnitudes values of 1.603e6, 1.075e6, and 6.981e5 mJy, for J, H and Ks, respectively. Scan 008 from the night of 980609n covers a relatively low density field with a total of 5,905 detections. Scan 022 from the night of 980627s has 11,314 detections, and scan 051, also from the night of 980627s, covers a very high density region with 94,694 detections.
Figure 1 - Flux measurement uncertainties plotted versus flux density
(both in mJy) for scan 008 on 980609n.
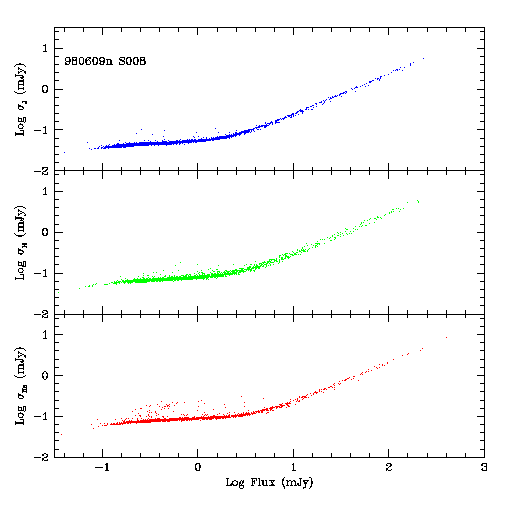
Figure 2 - Flux measurement uncertainties plotted versus flux density
(both in mJy) for scan 022 on 980627s.
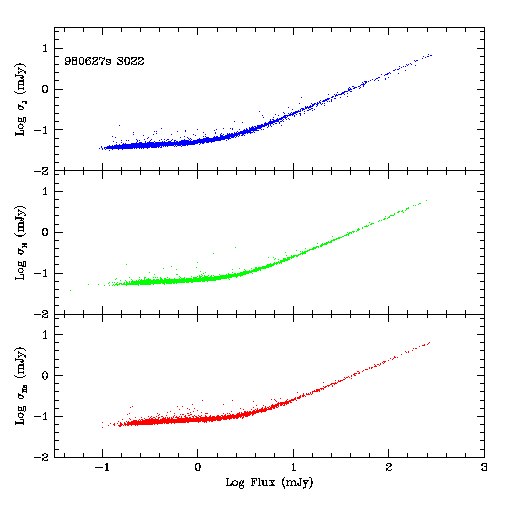
Figure 3 - Flux measurement uncertainties plotted versus flux density
(both in mJy) for scan 051 on 980627s.
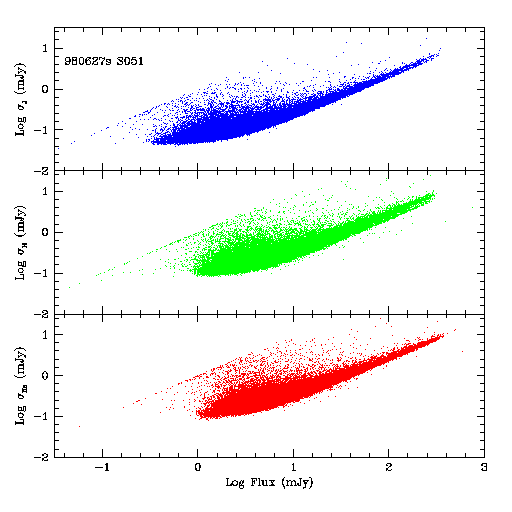
At low source flux densities, where the uncertainties are dominated by background photon noise, the uncertainties remain relatively constant, increasing only slowly with source brightness. Because most sources detected in a scan have low flux density, this suggests that the PROPHOT uncertainty is a reasonable way to measure the characteristic noise of a scan. For brighter objects, the uncertainties approach the familiar constant SNR regime where source photon noise and pixelization errors become important. The noise distribution in the very high density field shows a number of "features" caused by un-flagged artifacts.
Measuring the Characteristic Point Source Noise in a Scan
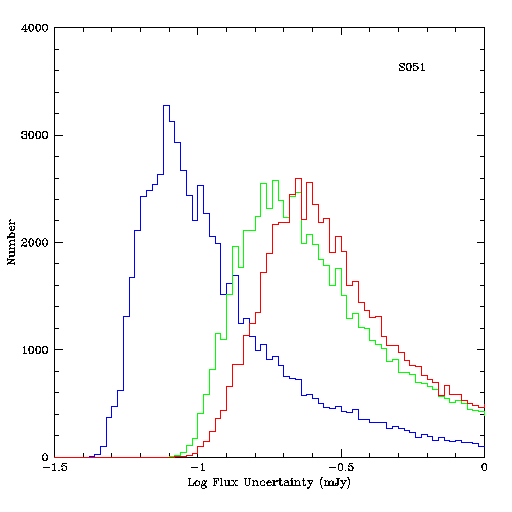
Figures 4-6 show histograms of the PROPHOT measurement errors for the three scans. All three histograms show clear peaks in the noise distribution for faint objects, and these peaks can be used as simple mode estimators for the error distributions. The roll-offs toward fainter flux levels are approximately Gaussian for the low and moderate density scans, and more complex for the high density scan. The tails toward higher noise levels due to crowding and other non-Gaussian effects are apparent.
Figure 4 - Histogram of PROPHOT flux uncertainties for all sources in
Scan 008 on 980609n. J-band uncertainties are shown in blue, H-band
in green and Ks in red.
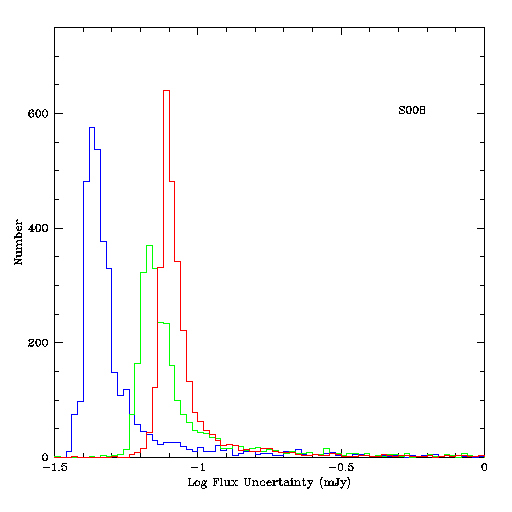
Figure 5 - Histogram of PROPHOT flux uncertainties for all sources in
Scan 022 on 980627s. J-band uncertainties are shown in blue, H-band
in green and Ks in red.
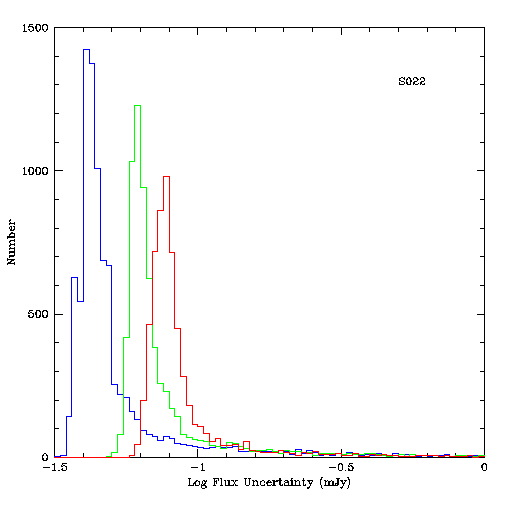
Figure 6 - Histogram of PROPHOT flux uncertainties for all sources in
Scan 051 on 980627s. J-band uncertainties are shown in blue, H-band
in green and Ks in red.
The Point Source Noise Response to Source Density, Background and Seeing
To be a useful noise estimator for the purpose of thresholding sources for catalog generation, the point source noise should respond to confusion noise due to source crowding, as well as other factors which affect sensitivity such as sky background levels and seeing. To investigate this, I have evaluated the characteristic point source noise from 1,186 photometric scans taken on the 19 northern and southern nights currently available on-line for production processing. The point source noise for each scan was measured by forming the histogram of the logarithm of the flux uncertainties quoted by PROPHOT for all R2-R1 sources not identified with artifacts (as in figures 4-7), and estimating the mode of the error distributions by selecting the peak bin of the histograms. The bin size of the histograms was 0.015 in log mJy, so there is some binning uncertainty, and in the event that two peaks were detected in the histograms, the lower noise peak was always selected.
a. Source Density
Figure 7 shows the points source estimates for all scans in the 19 nights, plotted as a function of the total number of detections in the respective bands. Data from the northern scans are shown in black and from southern scans in red. The J-band noise is shown in the top panel, H in the center and Ks at the bottom.
Figure 7 - Point Source Noise Estimate as a Function of Total Number of
Sources in a Scan (black = northern data, red = southern data) The total number of detections in a scan is not a robust estimate
of true source density (and therefore confusion noise) because
the point source detections algorithm automatically adjusts to higher
flux levels in response to higher source density. This is illustrated
in figures 8-10 which show the differential source counts for
each band in the the three sample scans discussed above. The completeness
level, as gauged by the multi-band turnover point (multi-bandedness is a
very good reliability indicator) in each curve
is nearly 2 magnitudes brighter in scan 051 compared with scans 008 and 022.
Figure 8 - Differential source counts for Scan 008 on 980609n. J-counts
are shown in blue, H in green, and Ks in red. Counts
for single band sources are shown as solid lines, and multi-band
counts are shown as dashed lines.
Figure 9 - Differential source counts for Scan 022 on 980627s. J-counts
are shown in blue, H in green, and Ks in red. Counts
for single band sources are shown as solid lines, and multi-band
counts are shown as dashed lines.
Figure 10 - Differential source counts for Scan 051 on 980627s. J-counts
are shown in blue, H in green, and Ks in red. Counts
for single band sources are shown as solid lines, and multi-band
counts are shown as dashed lines.
Figure 11 shows the point source noise estimate for each scan plotted
as a function of the total number of non-artifact detections brighter
than 13th magnitude in each band. This fiducial point was chosen
because it remains relatively complete in dense fields (it must
be somewhat incomplete, of course, particularly in Ks)
yet still has enough sources in low density scans to provide
a useful comparison. The distributions show that the point source
noise is clearly elevated in the densest scans, but remain relatively
unaffected for densities up to nearly 104 sources
per scan in the Ks band. Although the relationship between
the point source noise and density should be probed further with
some scans that fill out the density range sampled by these
data, it is clear that this noise estimator does respond to
increasing source density.
Figure 11 - Point Source Noise Estimate as a Function of Number of
M<13 Sources in a Scan(black = northern data, red = southern data)
Figure 12 - Point Source Noise Estimate as a Function of Mean Background
Level in a Scan (black = northern data, red = southern data)
Figure 13 - Point Source Noise Estimate as a Function of Mean Seeing Shape
in a Scan (black = northern data, red = southern data) The relationship between achieved point source photometric sensitivity
and the sky background and seeing has been investigated empirically
using the repeatability of photometry using the six-scan calibration
sets. The achieved SNR=10:1 (observed RMS=0.108 mags) level was
found to be proportional to a simple function of the mean seeing shape (SH)
and the mean frame background (BG). This function, called the
Photometric Sensitivity Parameter, scales as SH*BG+0.29.
Figure 14 shows the point source noise estimates plotted as a function
of the Photometric Sensitivity Parameter for the sample
scans, and there is a very clean dependence in the estimator on
this empirical sensitivity parameter.
Figure 14 - Point Source Noise Estimate as a Function of Photometric
Sensitivity Parameter (SH * BG0.29) (black = northern data,
red = southern data) The comparison between the point source noise estimator and the
Photometric Sensitivity Parameter allows us to get some feeling for
the meaning of this point source noise. For example, the analysis
of achieved photometric repeatability indicated that a scan
had a 50% probability of meeting the Level 1 Requirements for
photometric sensitivity at H and Ks for PSP values ~11.1.
Figure 14 indicates that for Ks, this corresponds to
a noise level of approximately 0.1 mJy. Thus, the SNR=10:1 level
would occur for sources with point source flux densities of ~1mJy,
which is essentially the Level 1 Sensitivity Requirement.
For the H-band,
extrapolation of the the northern data to PSP values of 11.1
indicates a point source noise of ~0.08 mJy. The southern data
points extrapolate to a slightly higher noise than the northern data,
~0.1 mJy (note that the PSP was defined using northern data only, and
has not yet been normalized for the south). Again, this suggests effective
SNR=10:1 levels around ~1mJy which is essentially the Level 1 Photometric
Sensitivity Requirement.
Given the tight relationship between the point source noise and
the PSP, one might be tempted to use the PSP to estimate the
effective noise level in a scan, and threshold using that noise.
Unfortunately, this is not viable because the PSP does not include
any correction for source density. The islands of scans at high noise
levels seen in figure 14 are the high density scans.
It should be emphasized that the point source noise estimator
discussed here provides a scan-average noise. For scans in which the
seeing and/or background vary rapidly, the characteristic noise
level may be inaccurate for portions of the scan. However, such
scans usually suffer from other problems such as residual background
structure due to severe airglow or PSF-mismatches, so this
error in the noise evaluation is not the most severe problem.
As a reference point, the maximum J, H and Ks scan point
source noise values from the 2MASS Sampler night, 971116n, are
0.046, 0.077 and 0.075 mJy, respectively. The equivalent SNR=6:1 levels
for these noise levels are 16.47, 15.91 and
15.48 magnitudes. The magnitude thresholds used to construct the
Sampler point source catalog were 16.5, 16.0 and 15.5 magnitudes
at J, H and Ks for multi-band sources. These thresholds were
established after extensive visual review of sources overlayed on images,
as well as examination of the completeness levels inferred from the
repeatiability of the photometry in the calibration scan sets.
The SNR limit for inclusion in the Spring data release must be determined
from analysis of the Release Working DB. To facilitate that analysis,
I recommend an initial cut on the Spring release catalog at a level
comparable, or somewhat below where recent discussions have centered.
For example, the initial cut could be made at SNR 5.
b. Sky Background
The photometric noise in a 2MASS scan will also be affected by the
absolute background level of the sky against which a source is
being measured, as well as the amount a point source is spread
out due to atmospheric seeing. In figure 12 is shown the
effective point source noise for the 1,186 scans plotted as a function
of the mean frame background level (in DN) for each scan.
For the majority of scans, the point source noise increase as
the square-root of the background, precisely as expected. There are
small islands of high noise points at intermediate backgrounds
in each band that correspond to the high density scans.
c. Seeing
Figure 13 shows the dependence on the point source noise estimate
for the 1,186 scans on the mean seeing shape value for each scan.
The difference between the medain seeing between hemispheres is clear
from this plot, and the slight displacement between the distributions
between north and south is likely due to differences in the PSFs
used for each. For both hemispheres, though, the point source
noise scales very roughly as SH0.6.
d. Point Source Photometric Sensitivity Parameter (PSP)
Effective Signal-To-Noise Thresholds for Catalog Generation
The discussion above illustrates that the modal point source noise
estimated from the distribution of photometric uncertainties
generated by PROPHOT provides a noise that scales properly with source
density, background and seeing. However, it does not
address the question of what effective SNR (defined as the
ratio between measured flux density for a source and the characteristic
point source noise for a scan) limits to use when selecting
sources for the release catalogs.
R. Cutri - IPAC
Last Update - 25 January 1999 14:00 PST