2MASS Point Source Photometric Precision and Sensitivity:
Dependence on Background, Seeing and Image Shape
R. Cutri - IPAC
Introduction
The 2MASS Level 1 Science Requirements stipulate that point source photometric precision be <5% RMS, and that the sensitivity must exceed SNR=10:1 at magnitudes of J=15.8, H=15.1 and Ks=14.3, respectively. In this memo, we examine the affect of background level, seeing and image asymmetry on the achieved photometric precision and sensitivity for point sources. Other factors, such as atmospheric transparency, source density (i.e. confusion noise), instrumental throughput, detector sensitivity and flat-field accuracy, also influence the photometric performance, and will be discussed in later memos.The six times repeated measurements of each calibration
field have been used to measure empirically the photometric performance
over very broad range of conditions experienced during the first year of
northern survey operations. The dependencies on these parameters
are used to set empirical thresholds to determine when general survey data
satisfy the Level 1 Requirements. These thresholds can in turn be
used to assign quantitative quality scores to random survey scans.
Measuring Photometric Precision and Sensitivity
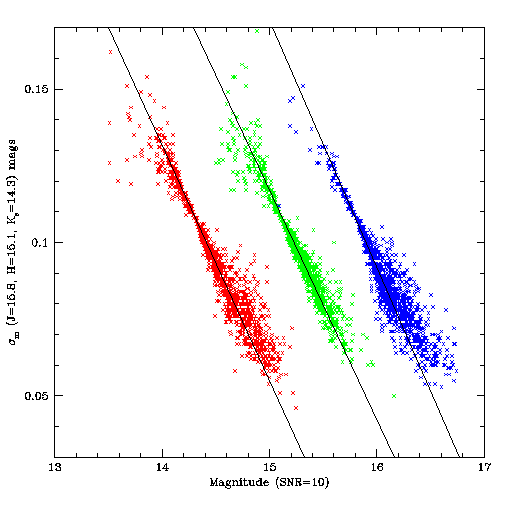
The achieved photometric performance is determined empirically from the photometric repeatability of the high signal-to-noise stars in the 6-times observed calibration tiles during each calibration observation. Source lists from each set of 6 calibration scans are positionally merged, and the mean and RMS magnitude of each source in the calibration set evaluated. Figure 1 shows a plot of the measured RMS per source as a function of the mean magnitude in J, H and Ks for the sources in scans 049-054 covering the P247-U calibration tile, observed on 980114 UT at Mt. Hopkins. J repeats are in the top panel, H in the center, and Ks in the lower panel. The x's represent the individual sources that were detected > 5 out of the 6 scans. Sources detected <5 times are plotted as red points. Marked in green are the trimmed-average dispersions for all sources in 0.5 magnitude bins. For reference, the SNR=10:1 dispersion level is denoted by the blue horizontal line, and the magnitudes at which the sensitivity should be >=10:1, as specified in the Level 1 Requirements, are denoted by blue vertical lines for each band.Figure 1 - Photometric Repeatability for the P247-U Calibration Tile Measured on 980114 UT
Three parameters that characterize the achieved photometric
performance can be measured from the repeatability statistics:
- Photometric Precision - the mean photometric dispersion in the constant SNR magnitude regime, between the R2-R1 saturation level and the point where the repeatability curve begins to turn up (approximately 9<J<14, 8.5<H<13.5, 8<Ks<13). This corresponds to the regime in which photometric errors are dominated by non-photon noise effects, such as pixelization errors, and flat-fielding residuals. In the example above, the photometric precision is measured to be 0.017, 0.020 and 0.025 mag. at J, H and Ks, respectively.
- Photometric Uncertainty at the Level 1 Magnitudes - the photometric dispersion at J=15.8, H=15.1 and Ks=14.3 magnitudes, measured by interpolating the 0.5 magnitude bin-averaged dispersions. The dispersion must be <0.1086 mag. to satisfy the Level 1 Requirements. For the data shown in Figure 1, the dispersion at these magnitude levels is 0.071, 0.094 and 0.071 mag. at J, H and Ks, respectively.
- Magnitude for Achieved SNR=10:1 - the magnitude at which the observed dispersion equals 0.1086 magnitudes. This is also measured by interpolating the 0.5 magnitude bin-averaged dispersions. These values should be equal to or fainter than the magnitudes specified by the Level 1 Requirements. In the example above, SNR=10:1 is achieved at J=16.16, H=15.30 and Ks=14.86 mag. Note that if the completeness level of the data is compromised by atmospheric extinction, confusion noise, or other factors, there may not be enough >5-times confirmed sources in faint magnitude bins to actually cross the SNR=10:1 level.
Correction for Photometric Zero Point Offsets
The photometric repeatability statistics were accumulated for calibration scan sets before photometric zero point offsets were applied. The application of photometric zero point offsets has the affect of sliding horizontally the repeatability statistics plots (e.g. Figure 1).
Typical zero point offsets for Mt. Hopkins data are small, generally in the range +/-0.3 mags, so the measured photometric precision is relatively unaffected by the calibration. The magnitude for achieved SNR=10:1 and photometric uncertainty at the Level 1 Mag. specs will be slightly affected, however. If left uncorrected, the variation in zero point offsets would result in increased scatter in the distribution of those values.
It is obvious from Figure 1 that there will be a strong correlation between the mean photometric uncertainty at the Level 1 magnitudes, and the magnitude at which SNR=10:1. Figure 2 shows that relationship plotted for all calibration scan sets that have a photometric precision <0.04 mags (this should act as a first order filter to eliminate sets that may be affected by clouds).
Figure
2 - Mean Photometric Uncertainty plotted as a Function of the Level 1 Magnitudes
The relationship between the the achieved dispersion
and SNR=10:1 magnitude is linear within +0.3 mags. of the
Level 1 magnitudes, and the slope is nearly identical for all three bands
(J: -0.080, H: -0.075, Ks: -0.077 mag.disp/mag.).
We use these slopes to correct the measured mean dispersions using the
zero point offsets for all of the calibration scan sets obtained on nights
deemed photometric. For example, the zero point offsets evaluated
for 980114n were +0.079, +0.007 and +0.029 magnitudes at J, H and Ks,
respectively. This means that the calibrated magnitudes are slightly
fainter than the instrumental mags, and therefore the measured magnitudes
at which SNR=10:1 are slightly fainter than shown in Figure 1, and the
mean dispersions at the Level 1 magnitudes are correspondingly lower (this
is good!). Correcting the mean dispersion given in the preceding
section using the measured zero point offsets and slopes given above yields
corrected mean dispersions of 0.065, 0.093 and 0.069 mags at J, H and Ks,
respectively.
The photometric repeatability statistics were corrected
for 873 calibration scan sets taken from 110 nights deemed photometric
in either operational or 24hr QA processing. These corrected statistics
are used in the analyses presented below, unless otherwise noted.
Photometric Precision
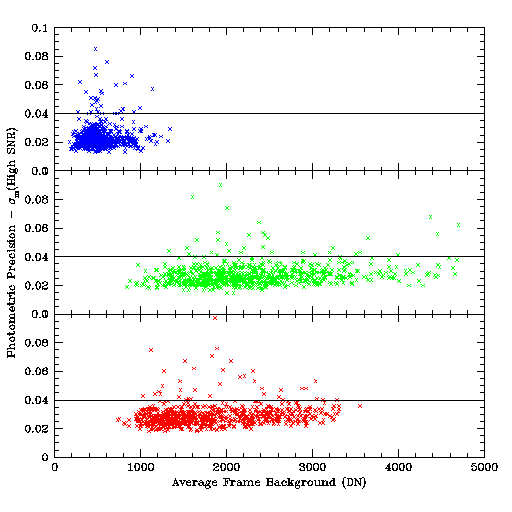
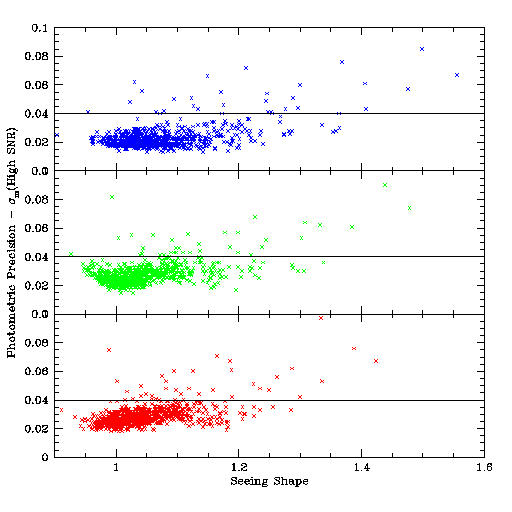
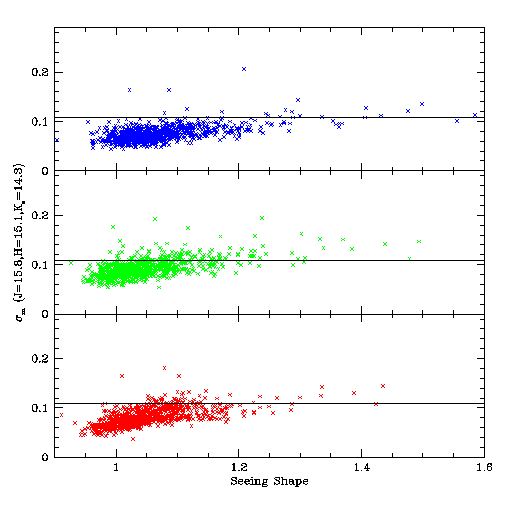
Figures 3-5 below, illustrate how the measured photometric precision varies as a function of the average frame background, seeing shape and image moment ratio for all scan sets. The precision is relatively unperturbed by high backgrounds since the measurements are being made in a non-photon noise limited regime. It should be noted that there are a small number of calibration scans that have extremely high H background (5000-10000 DN) because of OH airglow. The most extreme of these do show degraded precision, but the calibration analysis for these cases usually yields non-photometric conditions.There is a weak dependence of the precision on seeing, particularly in the H and Ks bands, and precision may become compromised in those bands for seeing shapes >1.3. The upturn in the precision for the very lowest seeing shape values in the H data is not understood.
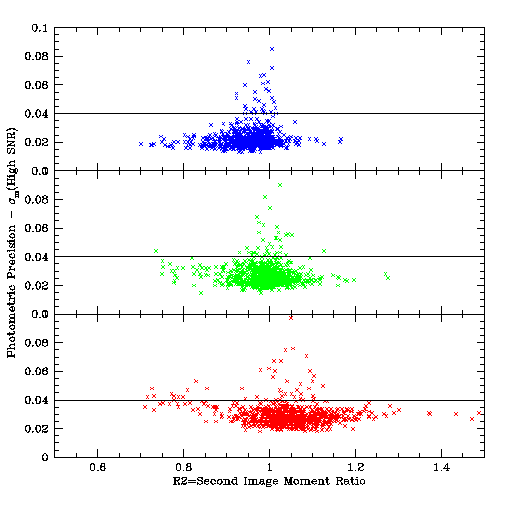
Photometric precision has a weak dependence on image moment ratio. Ks band is the most severely affected primarily because that band shows that largest range of image asymmetry in the northern camera. The calibration scan sets with the worst image asymmetry problems have effectively been filtered out of this analysis because of the limitation on using data deemed to be photometric. Examination of the precision vs. moment ratio plot for all of the scans (Figure 6) shows that for moment ratios < 0.75, approximately 50% of the cal sets fail to meet the Ks photometric precision spec. Moment ratios < 0.6 result in essentially all Ks data failing spec. Fortunately, only a very small fraction of all scans fall into this range. (see Figure 9 in 2MASS Seeing and Image Shape Statistics for the First 6 Months of Mt. Hopkins Operations).
Figure 3 - Photometric Precision as a Function of Average Frame Background
Figure
4 - Photometric Precision as a function of Seeing Shape
Figure
5 - Photometric Precision as a Function of Image Moment Ratio
Figure
6 - Photometric Precision as a Function of Image Moment Ratio (all data)
Photometric Uncertainty at the Level 1 Requirement Fiducial Magnitudes
Figures 7-9 below illustrate how the achieved photometric uncertainty at J=15.8, H=15.1 and Ks=14.3 mags. (calibrated) varies with average frame backgrounds, seeing shape and image moment ratios in the cal sets.The photometric uncertainty at the Level 1 fiducial magnitudes has a clear dependence on background, seeing and image asymmetry, as expected. For a fixed point source image shape, as the background increases, the contrast of the source with respect to the background decreases, and thus the accuracy with which it can be measured decreases. Similarly, for a fixed background level, as the profile of a point source is smeared over more pixels due either to seeing or image elongation, the accuracy with which it can be measured decreases.
The fact that the photometric sensitivity varies with
all of these parameters means that it is not sufficient to set simple thresholds
in each parameter to determine whether 2MASS data meet the Level 1 Requirements.
Clearly, there is greater tolerance to poor seeing or image elongation
if the backgrounds are low, and higher backgrounds can be tolerated when
the seeing is good than when it is poor or when images are elongated due
to focus. This interrelationship between the three parameters (among
others) is the source of the considerable width of achieved uncertainties
for given values of background, seeing and moment ratio.
Figure 7 - Mean Photometric Uncertainty as a Function of Average Frame Background
Figure
8 - Mean Photometric Uncertainty as a Function of Seeing Shape Parameter
Figure
9 - Mean Photometric Uncertainty as a Function of Image Moment Ratio
Magnitudes for Achieved
SNR=10:1
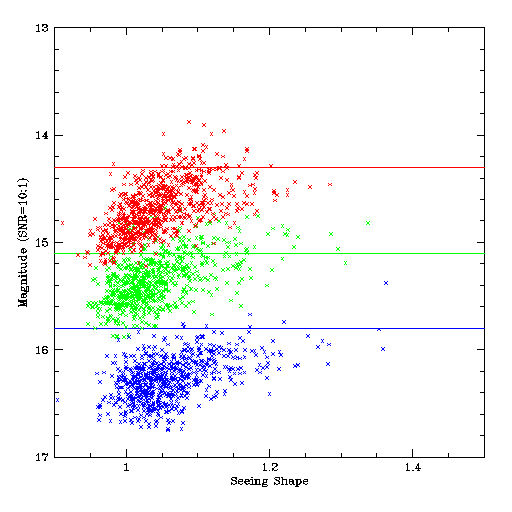
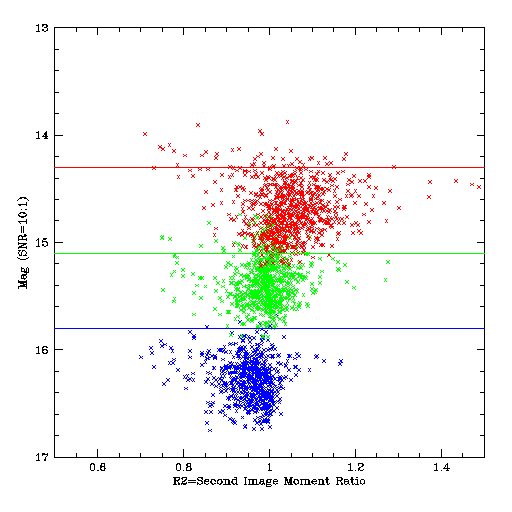
Figures 10-12 below illustrate how the magnitudes at which the achieved sensitivity reaches 0.1086 mags. varies with average backgrounds, seeing and image moment ratio for the calibration sets. The blue, green and red horizontal lines in the plots indicate the magnitudes specified by the Level 1 Science Requirements for photometric sensitivity at J, H and Ks, respectively. For clarification, data are plotted only for calibration scan sets in which the photometric precision is <0.04 mags.
As with the photometric uncertainty, the SNR=10:1 magnitudes show clear dependencies on background, seeing and image asymmetry (not surprising since photometric uncertainty and SNR=10:1 magnitude are highly correlated). Because of the codependency on all three parameters, it is not sufficient to threshold data on the parameters individually. This could result in actually discarding useful data since there appear to be calibration sets that meet the Level 1 Requirements at even the worst background levels, seeing values and image moment ratios.
Figure
10 - Magnitudes where SNR=10:1 as a Function of Average Frame Backgrounds
Figure
11 - Magnitudes where SNR=10:1 as a Function of Average Seeing Shape
Figure
12 - Magnitudes where SNR=10:1 as a Function of Image Moment Ratio
A Photometric Sensitivity Parameter
As mentioned previously, a considerable amount of the scatter in the plots shown above arises from the fact that photometric sensitivity is affected by several factors. To illustrate this, Figure 13 shows the Ks photometric uncertainty as a function of average frame background (as in the bottom panel of Figure 7), but with data taken under different seeing shape ranges encoded in different colors. For a fixed average background value, better seeing leads to improved photometric sensitivity. Within each seeing shape range, the achieved sensitivity scales approximately as the square root of the background, as expected. There is a 500-1000 DN difference in the maximum tolerable background between the best and worst seeing conditions.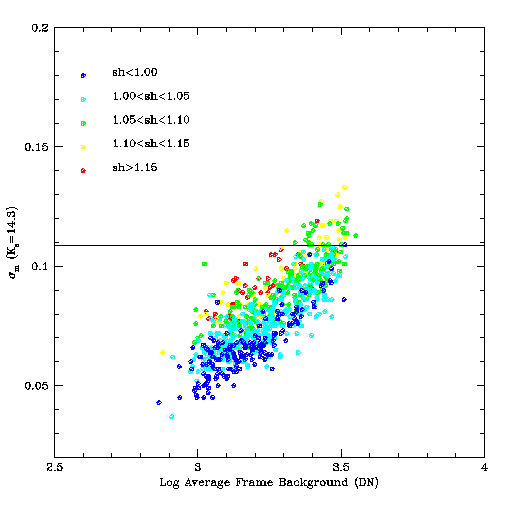
Given the codependency of photometric sensitivity on seeing
and background (image moment ratio will be discussed in a moment), it is
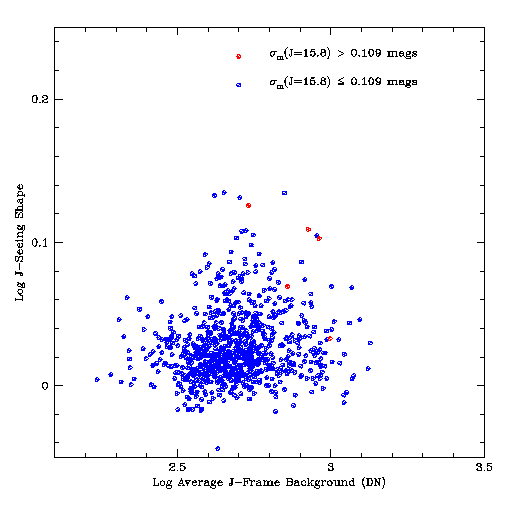
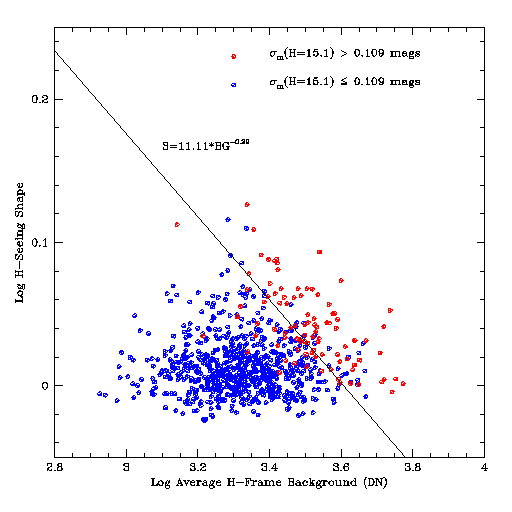
natural to plot the two parameters against each other. Figures 14-16
show the average seeing shapes plotted against average frame background
values for all photometric cal scan sets. Filled blue circles are
used to denote cal sets in which the uncertainty at the Level 1 Requirement
fiducial magnitudes is <0.1086 mags (let us refer to these as
the hi-snr data). Red filled circles denote cal sets
in which the photometric dispersion is >0.1086 mags (refer to these as
low-snr data).
Figure
14 - J-Seeing Shape as a Function of Average Frame Background
Figure
15 - H-Seeing Shape as a Function of Average Frame Background
Figure
16 - Ks-Seeing Shape as a Function of Average Frame Background
Several conclusions can be drawn from these figures:
1. J-band data will virtually always satisfy the Level 1 requirements over the range of seeing and background conditions observed at Mt. Hopkins. The caveat to this is that we have filtered out the worst data by selecting on those data deemed photometric, usually by the automated processing from the 24hr QA diagnostics.
2. The distribution of H and Ks points are nearly identical, although more H-band data fails to meet the photometric sensitivity requirements. H-band is more problematic because of the OH airglow. The two bands should have similar relationships between sensitivity and seeing/background since the detectors are operating in a similar photon noise regime.
3. Data which do and do not satisfy the Level 1 Requirements for sensitivity separate roughly along a diagonal in the these plots, with the highest quality data having low backgrounds and good seeing. Figure 17 illustrates the clear relationship between achieved sensitivity and seeing/background. In this Figure are plotted the mean seeing shape plotted versus mean background for all of the photometric H and Ks data, but with different ranges of achieved sensitivity at the Level 1 magnitudes coded in different colors.
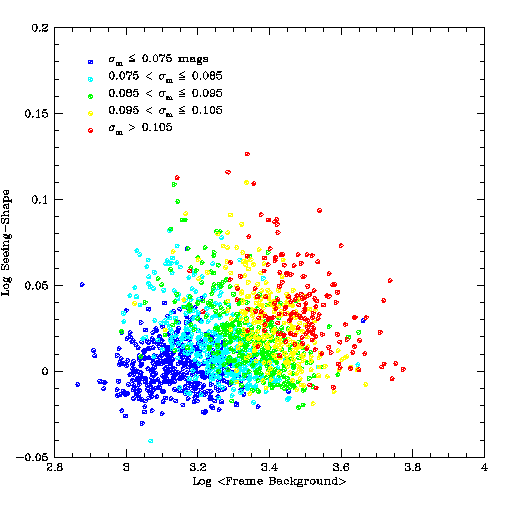
A fit to the diagonal line separating the cal scan sets which satisfy the Level 1 requirements (hi-snr) from those that do not (low-snr) was made by considering the shape and background values for cal set within intervals of 0.005 in seeing shape. Within each shape interval, the value of the background, BGs, for which there are an equal number of hi-snr cal scans sets with mean backgrounds >BGs as there are low-snr cal scan sets with backgrounds <BGs was evaluated. This can be thought of as the point were the probability distribution function for meeting the Level 1 sensitivity requirement is approximately 50%. A power law fit was then made between the mean value of the seeing shape interval and the value of BGs for that interval. This gave a relationship between seeing shape and background with a slope of -0.29.
The precise normalization of the power law separators between the red and blue distributions was derived for the entire sample by forming histograms of the photometric sensitivity parameter PSP=sh*BG+0.29 for the two data sets, and determining the value of the parameter at which there are equal numbers of hi-snr data extending into the red distribution and low-snr data extending into the blue distribution. Figure 18 shows the histograms for sh*BG+0.29 for the high and low SNR data, in blue and red, respectively. The vertical lines indicate the breakpoints between the two distributions as described above. These values are 11.11 for H and Ks. Note that the vertical line in the J histogram is for informational purposes only. The diagonal lines in Figures 15 and 16 show the normalized separating lines between high and low SNR data sets.
Figure
18 - Histograms of the sh*BG+0.29 parameters for High
and Low SNR calibration sets
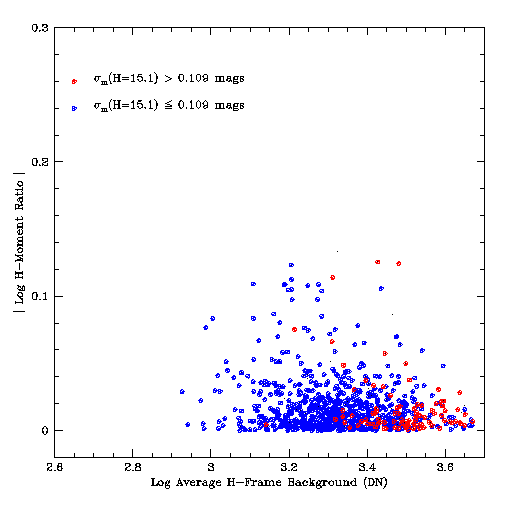
Figure 19 shows that the separation between hi-snr and low-snr cal sets as a function of moment ratio-background is not nearly as clean as in the seeing shape-background space. Because there is a correlation between the seeing shape estimator and the image moment ratio, as shown in 2MASS Seeing and Image Shape Statistics for the First 6 Months of Mt. Hopkins Operations , image asymmetry due to telescope focus is absorbed into the seeing shape estimator, and thus into the shape-background photometric sensitivity parameter. Therefore, image moment ratio should probably not be used specifically to distinguish between data that do and do not meet the Level 1 Requirements for point source photometric sensitivity. However, as indicated in Figure 6, the photometric precision in the Ks band begins to be seriously degraded for moment ratios <0.7. In addition, data with highly asymmetric images will in all likelihood be rejected on other grounds, such as extended source processing considerations.
Figure
19 - Ks Image Moment Ratio as a Function of Average Frame Background
Practical Limits for the Survey
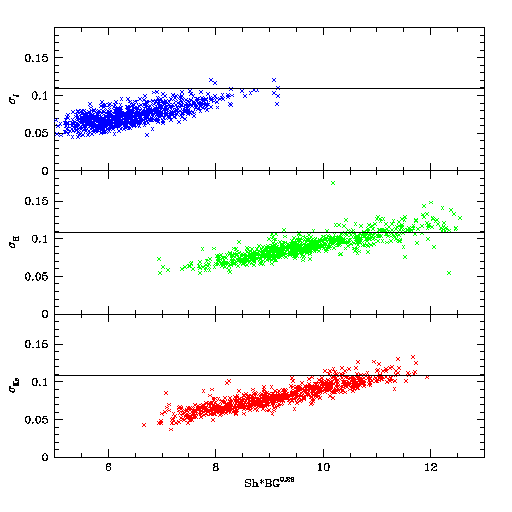
Figures 20 and 21 show how the photometric uncertainty
at the Level 1 Requirements fiducial magnitudes and the magnitudes at which
SNR=10:1 vary as a function of the photometric sensitivity parameter PSP=sh*BG+0.29.
Both values scale roughly linearly with the sensitivity parameter.
Note that there is a bias in these distributions towards large values of
PSP because when photometric
sensitivity begins to drop off completeness will as well. This will
result in insufficient numbers of source confirming >5 out of the
6 cal scans, and thus will result in no estimate of the photometric uncertainties
or limiting magnitudes being made.
Figure 20 - Photometric Uncertainty as a Function of the Photometric Sensitivity Parameter
Figure
21 - Magnitude at which SNR=10:1 as a Function of the Photometric Sensitivity
Parameter
The relationships shown in Figure 20 and 21 can be fit
well with linear terms, and the slopes are essentially the same in all
three bands. In fact, the relationships will remain approximately linear
for a wide range in the power law index used in the sensitivity parameter
(sh*BG+alpha). However, values of alpha significantly
different from 0.29 do not fit the distributions in Figures 15 and 16.
The terms in the linear fit of mag(SNR=10:1) versus PSP
are given below.
|
|
|
|
|
|
|
|
|
|
|
|
|
|
|
|
The scatter in the relationships shown in Figures 20 and 21 indicates that it is not sufficient to set simple thresholds based on the linear relationships to assess quality for survey data. While the average H and Ks data fails to meet the Level 1 sensitivity requirements when PSP>11.11, there are many cal scan sets that do satisfy the spec that have sensitivity parameters larger than 11.11. It would be incorrect to reject those data outright.
The overlap between the high and low SNR data in Figures 15 and 16 provides a natural means to assign relative photometric sensitivity quality values to the data. We can derive an empirical probability distribution that data with a specific value of seeing shape and background level meet the requirements from the ratio of the cumulative distributions of the sensitivity parameter for high and low SNR data (analogous to the histogram shown in Figure 15). The ratio is
PSPmax is the mean
demarcation point between the high and low SNR cal scan data as described
above, and hisnr and lowsnr refer to cal sets that exceed
or fall below the sensitivity requirement, respectively. The
table below shows the quality ratio, Q, as a function of sensitivity parameter,
PSP, for H/Ks. For reference, the mean
H and Ks magnitudes at which SNR=10:1 is achieved, according to the linear
relationships given in Table 1, are also provided. Note that data
ranked with nominal quality factors of 0 have sensitivity degraded by only
0.2-0.3 mags from the Level 1 Requirements.
PSP Q H(10:1) Ks(10:1)
<10.00
1.00 >15.30
>14.51
10.10
0.99
15.28
14.49
10.20
0.99
15.27
14.47
10.30
0.97
15.24
14.45
10.40
0.96
15.23
14.42
10.50
0.94
15.21
14.41
10.60
0.91
15.19
14.39
10.70
0.89
15.17
14.37
10.80
0.79
15.16
14.35
10.90
0.70
15.14
14.33
11.00
0.62
15.12
14.30
11.10
0.51
15.10
14.29
11.20
0.39
15.08
14.26
11.30
0.31
15.06
14.24
11.40
0.21
15.05
14.22
11.50
0.13
15.03
14.20
11.60
0.09
15.01
14.18
11.70
0.08
14.99
14.16
11.80
0.06
14.97
14.14
11.90
0.04
14.95
14.12
12.00
0.02
14.94
14.10
12.10
0.01
14.92
14.08
12.20
0.01
14.90
14.06
12.30
0.01
14.88
14.03
>12.40
0.00 <14.86
<14.01
Based on these analyses, I recommend that these photometric sensitivity quality factors be used in a multiplicative quality scoring scheme described in Rules for Quality Scoring of 2MASS Survey Scans. Figure 22 shows how the photometric sensitivity parameter is used in practice in assigning a sensitivity quality for a full night of operationally processed data from CTIO, in this case 000129s.
Figure 22 - Photometric Sensitivity Parameters for all Scans from 000129s
This figure shows the J, H and Ks PSP
values plotted for all calibration and survey scans on this night.
The horizontal dashed lines in the H and Ks panels denote the levels at
which the probability of data from a scan meeting the Level 1 sensitivity
requirements is 100, 75, 50, 25 and 0%, from bottom to top, respectively
(Q=1.0, 0.75, 0.5, 0.25, 0.0). The points for each scan are also
color coded as follows: blue - Q>1.0, green
1.0<Q<0.5, yellow - 0.5<Q<0.0,
red - Q<0 (none shown). On this particular
night, the OH airglow background was high early in the night, as was the
thermal background. The backgrounds lowered during the night, resulting
in decreasing PSP's.
Statistics for the First 10 Months of Survey Operations
Using the table of quality values above, 2MASS survey data would not be rejected outright unless PSP>11.8. Figure 23 show the cumulative distribution of the PSP values for the 873 H and Ks photometric cal scan data considered in this analysis. The vertical line indicates PSP=11.11, the point at which half the data will fail to meet the Level 1 sensitivity requirements. Assuming that the calibration scan data are representative of the range of conditions in which survey scans are acquired, the cumulative distributions indicate that ~5% of H data, and <1% of Ks data will be rejected. These numbers probably underestimate the total fractions slightly because by selecting photometric data from the automated assessments in 24hr QA, we have likely selected against poorer data. In any case, there will not be a large amount of data rejected overall because of sensitivity thresholding. Note, however, that during the first 2 months of survey operations when telescope focus led to sometimes severe image elongation, a larger fraction of data may be rejected.
The photometric precision and sensitivity will continue
to be monitored on a daily basis for the duration of the survey.
As new statistics are accumulated, the photometric sensitivity parameter
will reanalyzed to determine if it continues to serve as a proper indicator
of point source photometric performance.
R. Cutri - IPAC
Last Update 7/11/98