I. Overview
Objective - Select one apparition of multiply-detected sources for inclusion in the final Catalogs and Faint Source Augmentations.
Implementation - The selection algorithm is to be based on purely geometric criteria - select the apparition that is closest to center of its respective scan for inclusion in the Catalogs.
- Advantages
- Avoids imhomogeneity resulting from multiple chance to detect faint sources in overlap regions
- Better choice if dominated by systematic photometric and/or astrometric errors (e.g. scan edge effects due to distortion)
- Simple geometric algorithm easily handles complex overlap regions near tile corners and at poles
- Implemented and tested in IDR1 and IDR2
- Disadvantages
- Moving source may be double-counted or missed
- Confused by in-scan duplicates
- Unbounded edges not explicitly dealt with
II. Nature of Multiple Sources
- Scan-to-scan multiples - "Single" source falling in scan overlap regions observed multiple times
- In-scan multiples
- Multiple detections caused by PROPHOT panel problem
- Multiple detections caused by PIXPHOT precision problem (3 per 1e6 sources in first ~month of processing)
- Vast majority are close multiple sources where components are not consistently detected across all bands (e.g. one component detected in J and other component detected in H and Ks)
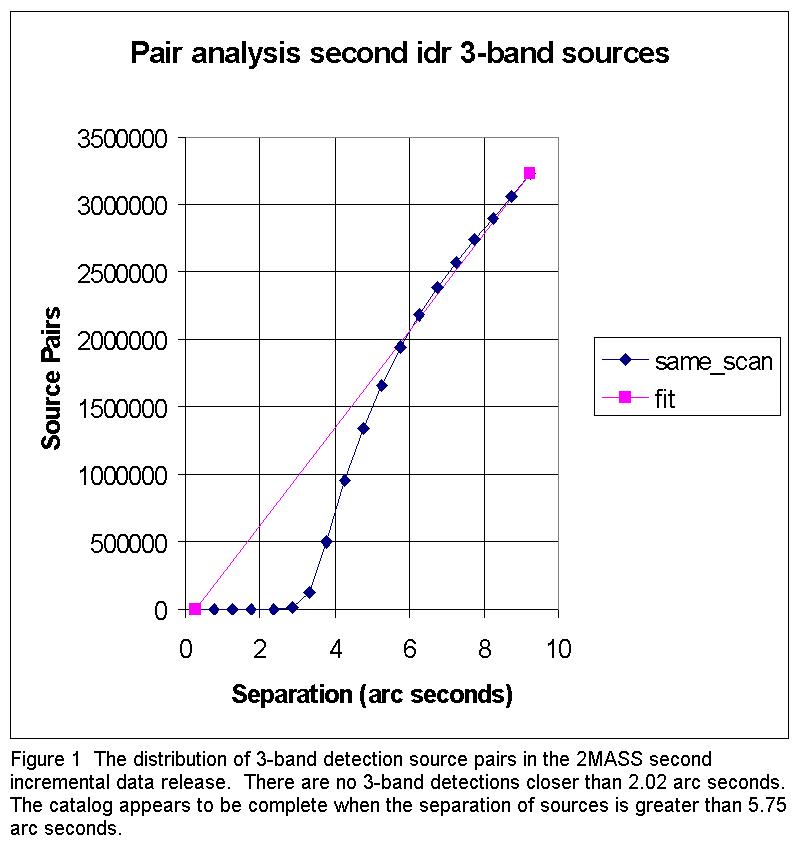
Figure 1 shows the distribution of separations of three-band sources, not in the same scan, taken from IDR2 Point Source Catalog. No three-band detections are closer than 2.02".
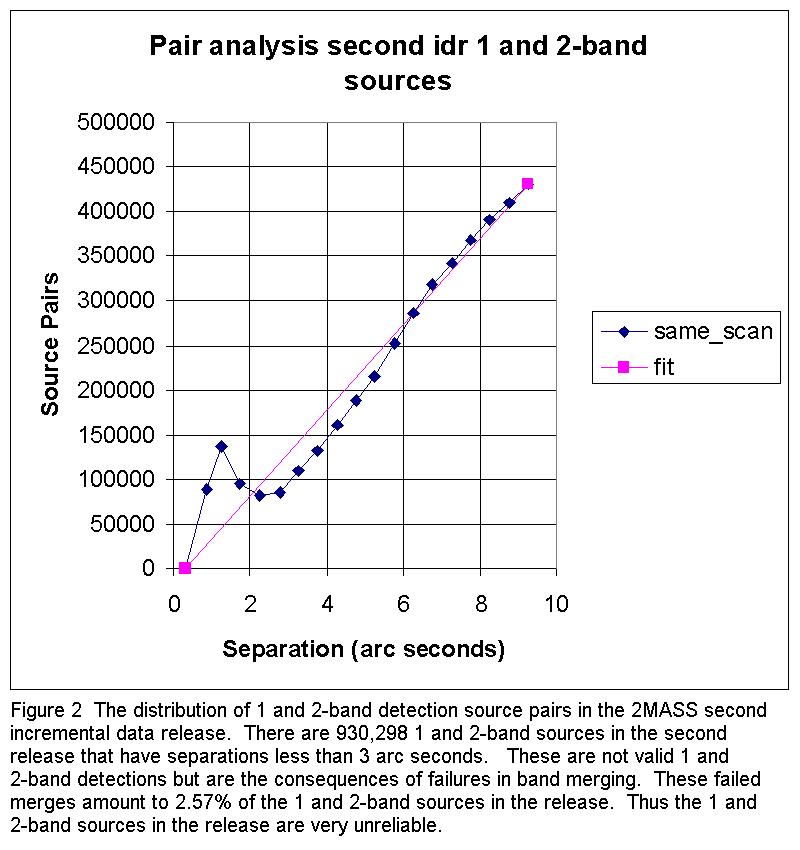
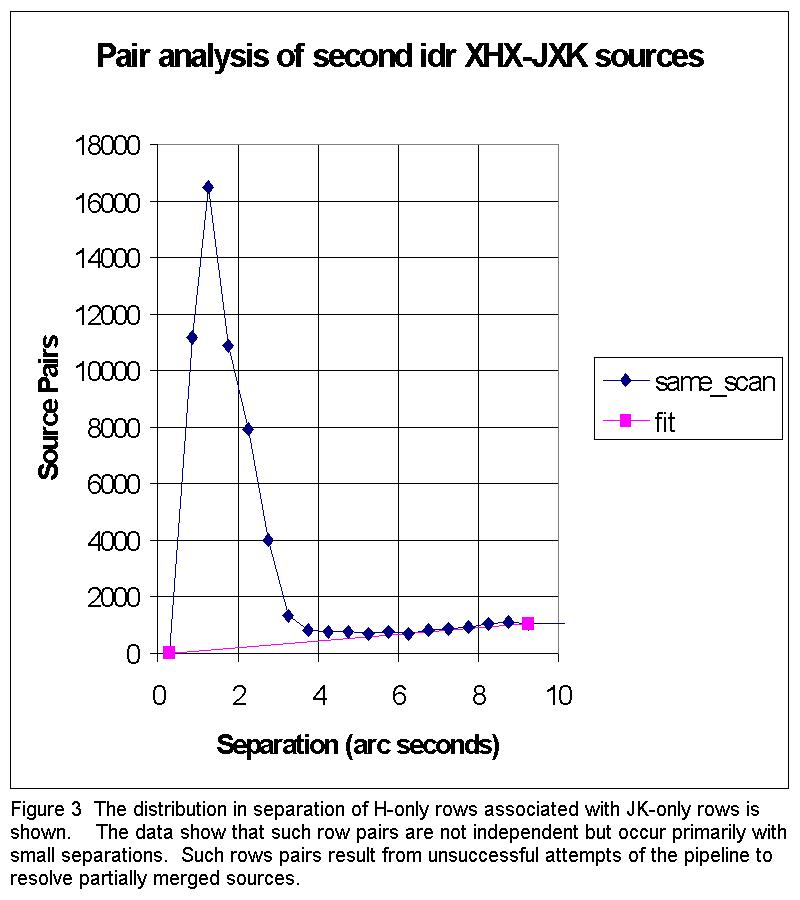
Figures 2 shows the distribution of separations of one and two-band sources from the same scan in the IDR2 Point Source Catalog. The peak at <2" separation are most likely in-scan duplicates resulting from close multiple sources inconsistently detected in different bands, which therefore did not bandmerge into a single source. This is illustrated in Figure 3 which shows the distribution of H-band only and JKs band sources in the same scan in the IDR2 PSC. In these cases, the H-band detection was offset far enough from the JKs-detections that bandmerge would not pull them together. Obviously, pairs with separations <1" are preferentially bandmerged.
 |
 |
 |
| Figure 1 | Figure 2 | Figure 3 |
III. Scan-to-Scan Multiple Source Resolution Algorithm
- Safety border around scans: consider only sources >10 arcsec (point sources) or >15 arcsec (extended sources) from scan edges to avoid band coverage problems (this is imposed during selection for Catalog Generation DB)
- Positionally correlate sources from adjoining scans in overlap region
- Consider only objects not identified with artifacts in scan processing
- Match radius < 2.0 arcsec (point sources) and < 5.0 arcsec
(extended sources)
- For all N>1 correlated source apparitions in or near overlap regions:
- Examine the horizontal (EW) and vertical (NS) distances from two nearest scan edges, dh and dv, for all apparitions of source.
- If the source is not detected in all observed scans that cover its position, then create a "virtual" duplicate of the source in the scans in which it was not detected. Use only virtual duplicates that fall more than the safety border distance from the edges of their respective scans.
- Determine the minimum of dh or dv for each apparition, real and virtual, in their respective scans.
- Select the apparation that has the larger of min(dh,dv). If a real apparition is selected, then it is included in the Catalog. If a virtual apparition is selected, then no source is included in the catalog. Note that this forms a somewhat complex boundaries between scans in the very corners, but it is simple to implement and document.
- The dup_src and use_src flags
- use_src - is set to the following values:
- "0" - If source in scan overlap region is not selected for inclusion into the catalog, per step 3 above
- "1" - If a source is not in a scan overlap region, or if it is in a scan overlap region and was selected per step 3 above.
- dup_src values represent the following:
- "0" - No positionally associated source within 2" in another scan, or the source does not fall within a scan overlap region
- "1" - One positionally associate source within 2" in another scan
- "3" - Triangular confusion. Primary source, aa
is positionally associated sources in another scan.
Pattern is:
a1 finds match with b1 and b2
b1 matches with a1 and
b2 matches with a1
(a1 is the primary source) - "4" = Confusion between two scans each having two sources
within 2".
a1 finds match with b1 and b2
a2 finds match with b1 and b2
b1 finds match with a1 and a2
b2 finds match with a1 and a2 - "5" = Confusion chain:
a1 finds match with b1
b1 finds match with a1 and a2
a2 finds match with b2 - "_1" - In addition to the confusion indicated in dup_src, a one(1) is appended to the dup_src flag if the use_src flag setting changed during the duplicate resolution processing. This change in the use_src flag can occur only for confused sources where assignment of the use_src flag depends on the scan being processed. If a use_src flag for a1 went from 1 to 0, then it will have gone from 0 to 1 for b1. Which apparition gets the final use_src of 1 depends on the order of processing. No other logic determines this.
Graphical Examples multiple source resolution
algorithm at work .
The multiple source resolution results are encoded in the dup_src and use_src flags carried with each source record in the Catalog Generation databases. These flags also help to signify when confusion is encountered during the multiple source resolution process. These flags are used to drive the final catalog source selection.
If the source was a non-duplicate (dup_src = 0, see below) but within an overlap area, then a pseudo-source would be used for each overlapping scan and distance to edge computed for the pseudo-sources. If the distance to edge algorithm picked a pseudo-source then the actual source would get dup_src=0 and use_src=0.
IV. Scan Overlap Statistics Generated During Multiple Source Resolution
A side benefit of the Multiple Source Resolution processing is that statistics on photometric residuals between scans can be efficiently generated. For each overlapping pair of scans in the Catalog Generation Database, the mean and RMS of the J, H and Ks photometric offset of all sources and just sources with SNR>20 are calculated. Astrometric offsets can also be evaluated during the same step.
Last Updated: 11 December 2001
R. Cutri, S. Wheelock - IPAC, R. Stiening - UMASS