Introduction
The sensitivity achieved during 2MASS observations was determined by instrumental, atmospheric, astronomical environment and software algorithm factors. This report examines how the atmospheric conditions at Mt. Hopkins and CTIO affected the depth and uniformity of the survey.
At any given time during the survey, measurement sensitivity is affected by the transparency of the atmosphere, the degree to which images are smeared by seeing, and by the level of background emission produced by the local environment and atmosphere. Maps are presented below that show the spatial variation of these parameters. Sensitivity is also affected by background confusion noise due to the astronomical sources themselves. These maps do not address the dependence of sensitivity on source density (i.e. confusion).
For the purpose of this report, sensitivity is described in terms of the magnitude at which photometric measurements are repeatable with an RMS equal to 0.1086 magnitudes. This corresponds to a repeatability signal-to-noise ratio of 10:1.
Photometric Zero Point Offset
The atmospheric transparency was determined as a function of time on each night of the survey by measuring the photometric zero point offsets from calibration scan measurements. The variation in sensitivity (in magnitudes) is directly proportional to the zero point offsets (in magnitudes).
The maps below show the photometric zero point offsets, in magnitudes, for each Tile in the final release. Left column shows cartesian equatorial projection with 0hRA in center of image and RA increases right to left. Right column shows cartesian galactic projection with equatorial coordinate grid. The range listed for each map represents full scale. The sense of the grey scale is the same of all maps on this page: lighter is higher sensitivity, darker is lower sensitivity.
 |
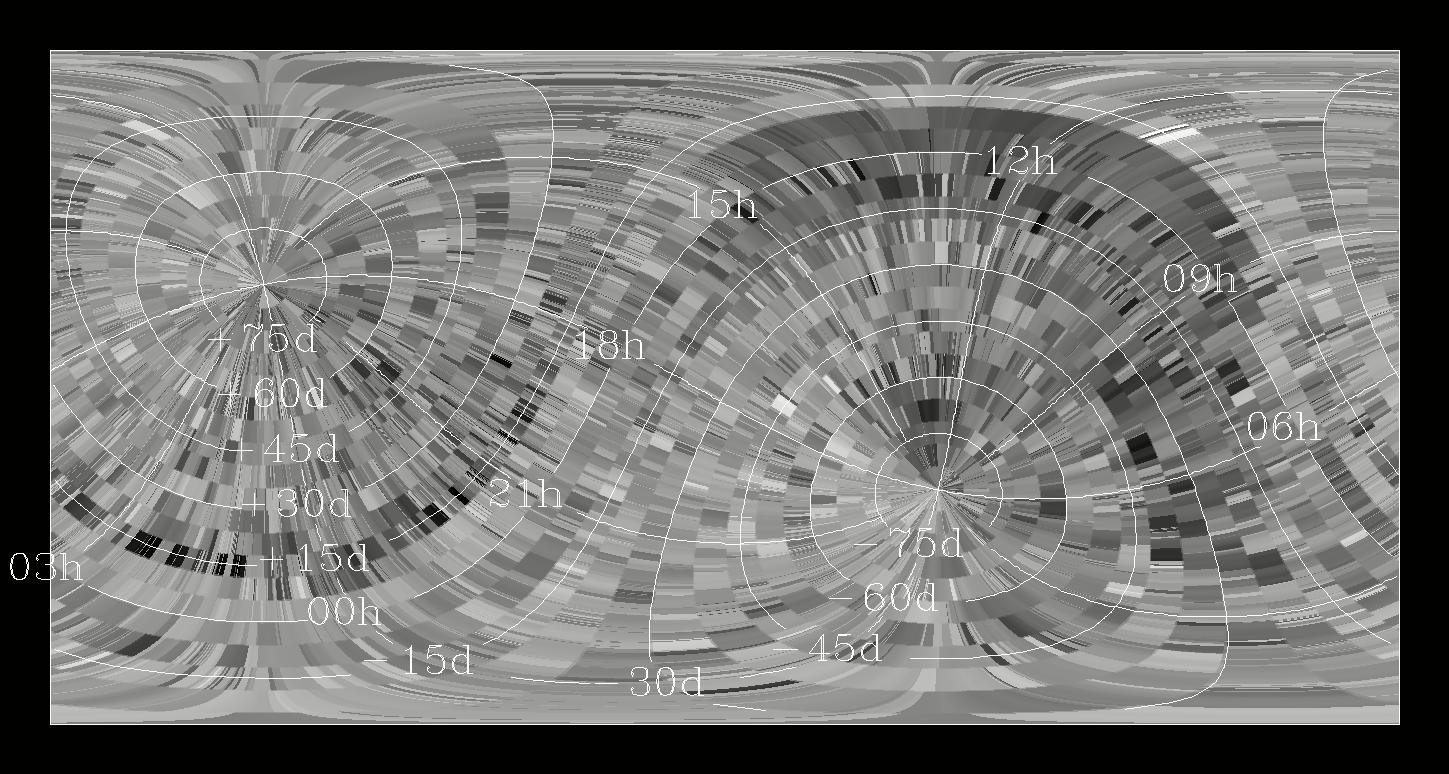 |
| J-band Zero Point - Range: -0.3 to +0.3 mag | |
 |
 |
| H-band Zero Point - Range: -0.15 to +0.11 mag | |
 |
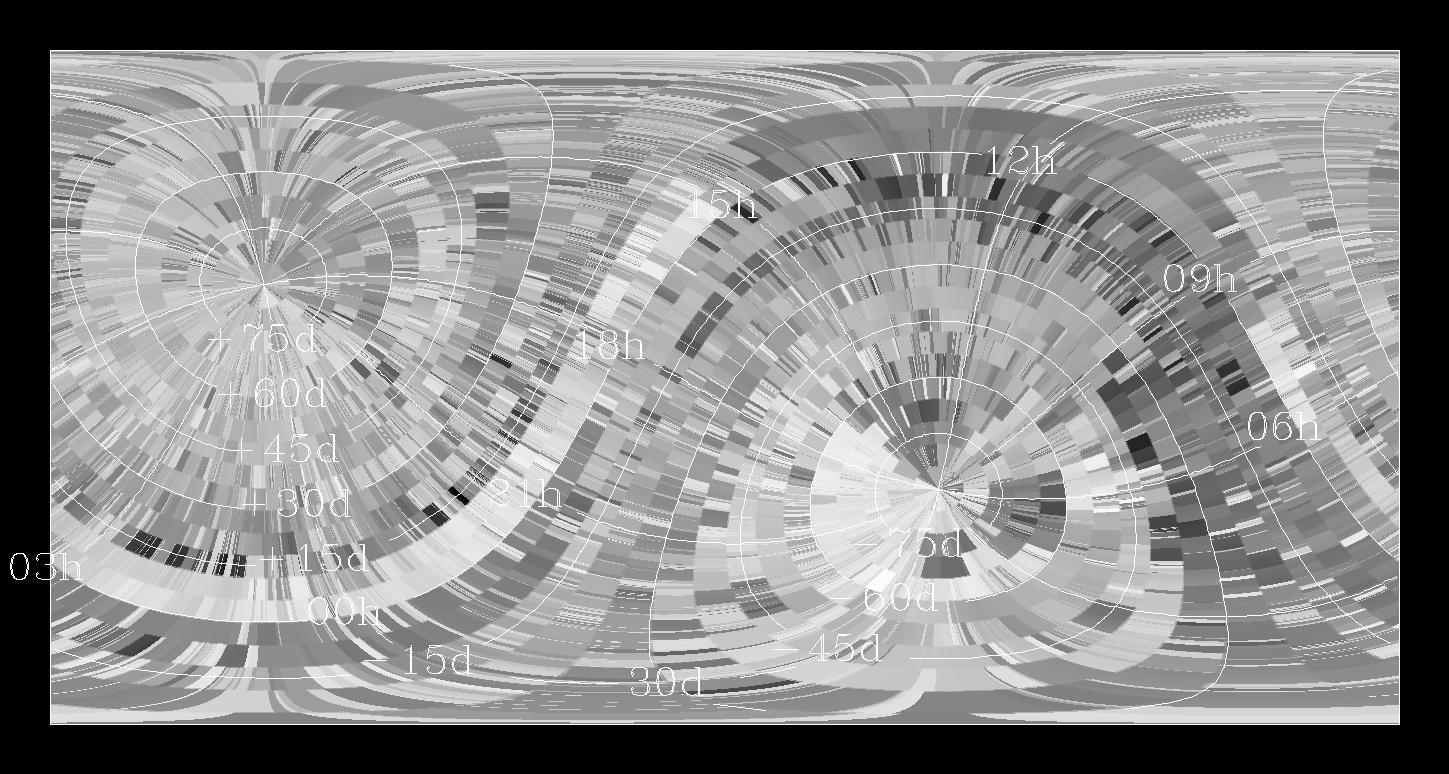 |
| Ks-band Zero Point - Range: -0.12 to +0.12 mag |
Photometric Sensitivity Parameter (PSP) - normalized to Mt. Hopkins
Earlier analyses have shown that the photometric sensitivity of survey observations is proportional to the photometric sensitivity parameter (PSP = sh*BG0.29).
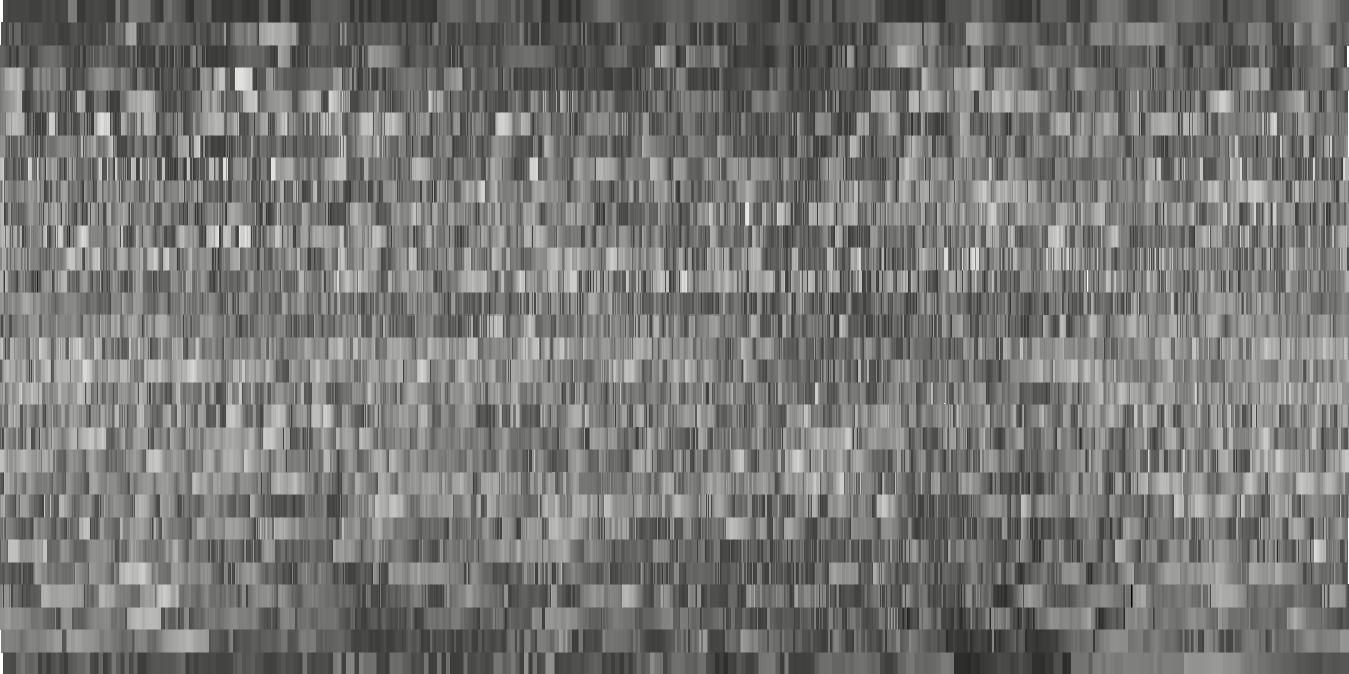
The following sky maps show PSP for each Tile in the final release. Left column shows cartesian equatorial projection with 0hRA in center of image and RA increases right to left. Right column shows cartesian galactic projection with equatorial coordinate grid. As discussed in Cutri (1998), the repeatability of point source photometry, as measured from calibration scan repeats, scales approximately as 0.2*PSP.
 |
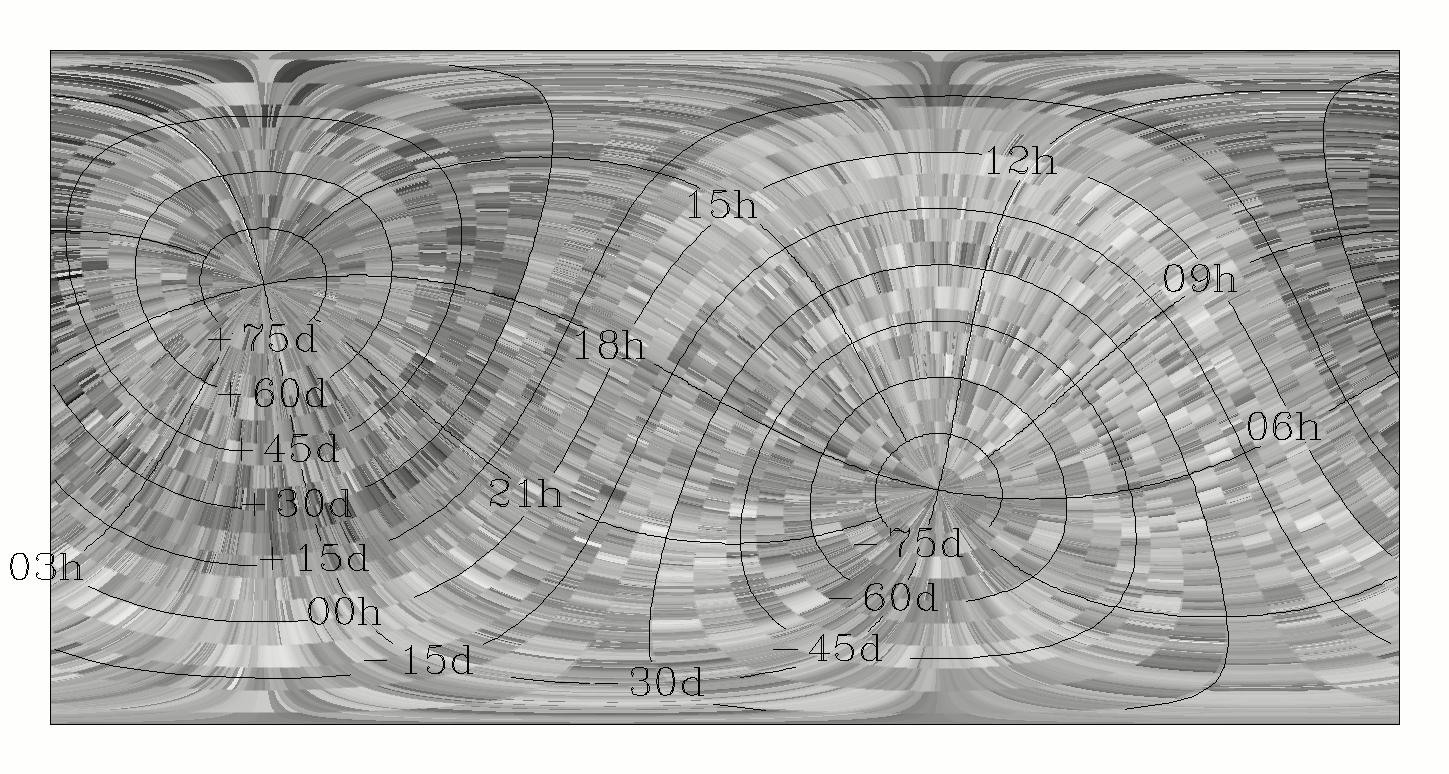 |
| J-band PSP - Range: 3.5 to 8.5 (~1.0 mag) | |
 |
 |
| H-band PSP - Range: 6.0 to 12.5 (~1.3 mag) | |
 |
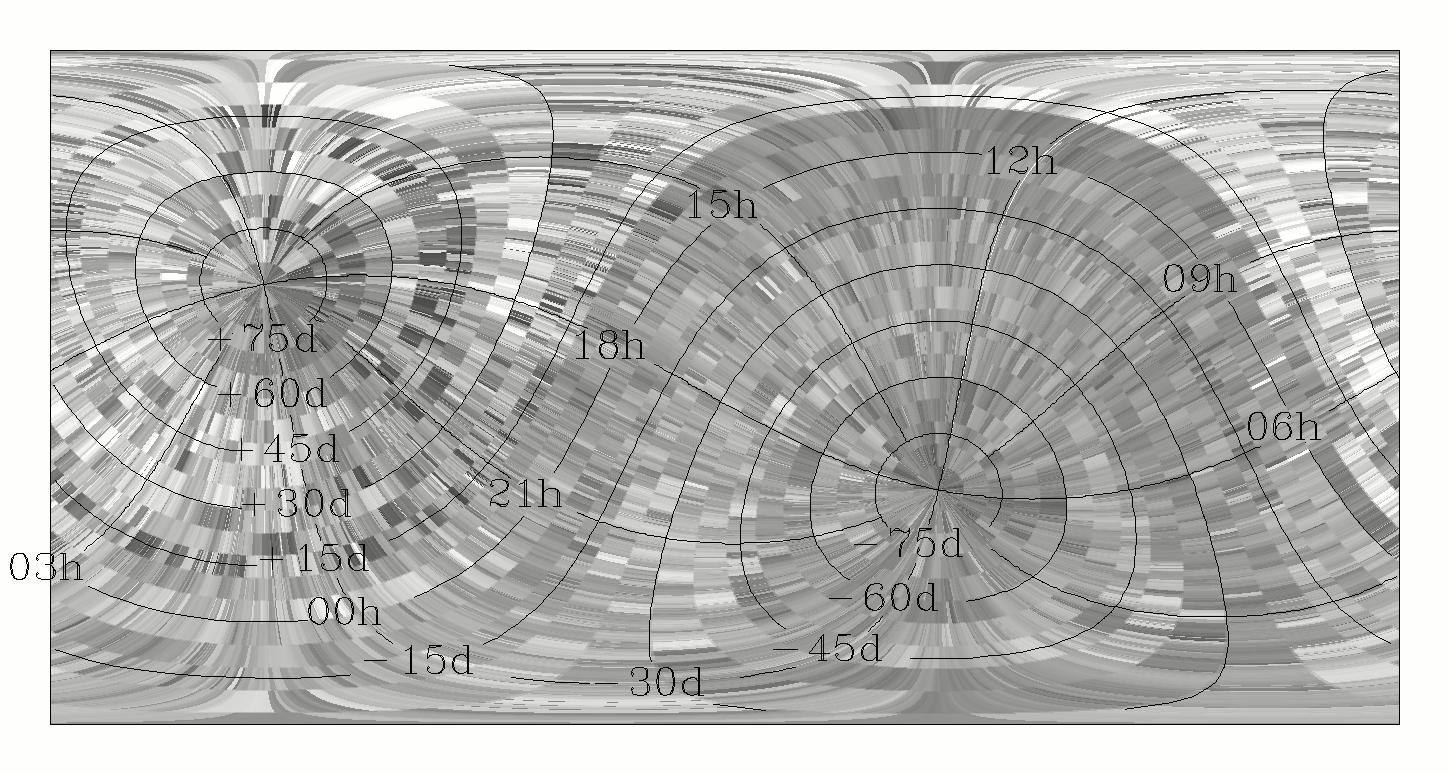 |
| Ks-band PSP - Range: 7.0 to 12.5 (~1.1 mag) |
10-sigma Repeatability Level
The magnitude at which repeated photometry of point sources is measured to have 10% dispersion in calibration scan sets is a linear function of the PSP value (M10:1=M0 + a*PSP). The Figures below show the empirical relationship between M10:1 and PSP for all calibration scan sets included in final 2MASS processing. The values of M10:1 have been corrected for photometric zero points. The best linear fits to the data are indicated on the plots, and the coefficients for the fits are summarized in Table 1.
 |
 |
| M10:1 vs. PSP for Mt. Hopkins data | M10:1 vs. PSP for Cerro Tololo data |
Table 1 - M10:1 vs. PSP Linear Fit Coefficients
| North | South | |||
| Band | M0 | a | M0 | a |
| J | 1.769046e+01 | -2.229045e-01 | 1.760870e+01 | -2.209914e-01 | H-all | 1.732510e+01 | -2.262366e-01 |
| H-old array | 1.721491e+01 | -1.922283e-01 | ||
| H-new array | 1.702783e+01 | -2.034906e-01 | ||
| Ks | 1.652409e+01 | -1.959570e-01 | 1.688037e+01 | -2.404991e-01 |
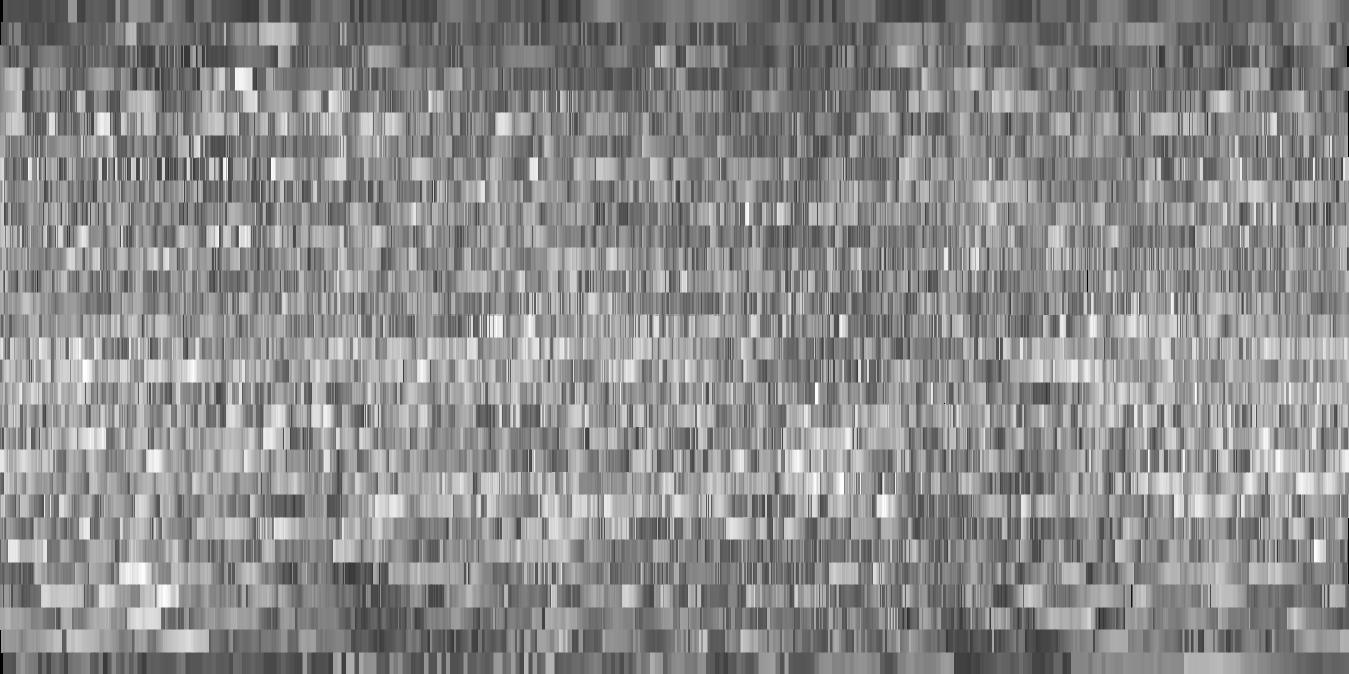
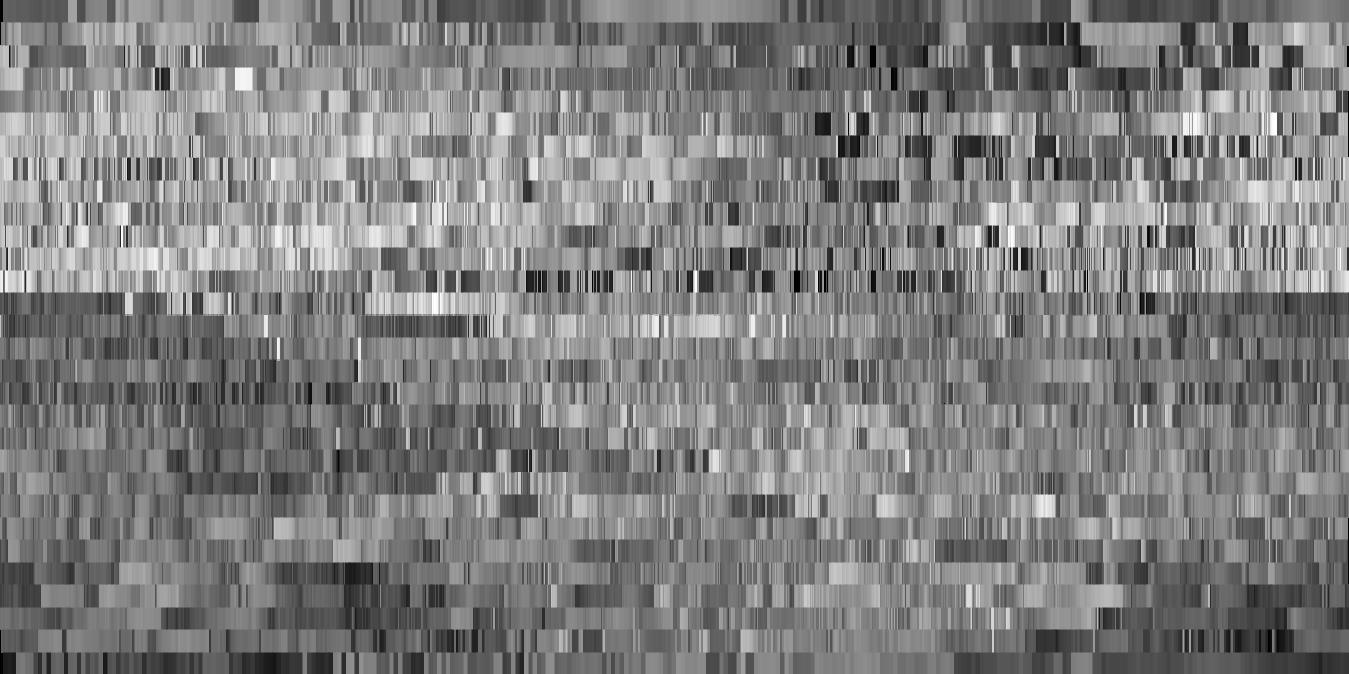
The linear coefficients in Table 1 were used to combine and transform
the photometric zero point and PSP distributions into effective
sensitivity maps for all Tiles in the final release using the following
relation:
 |
 |
| J-band M10:1 - Range: 15.8 to 16.9 mag | |
 |
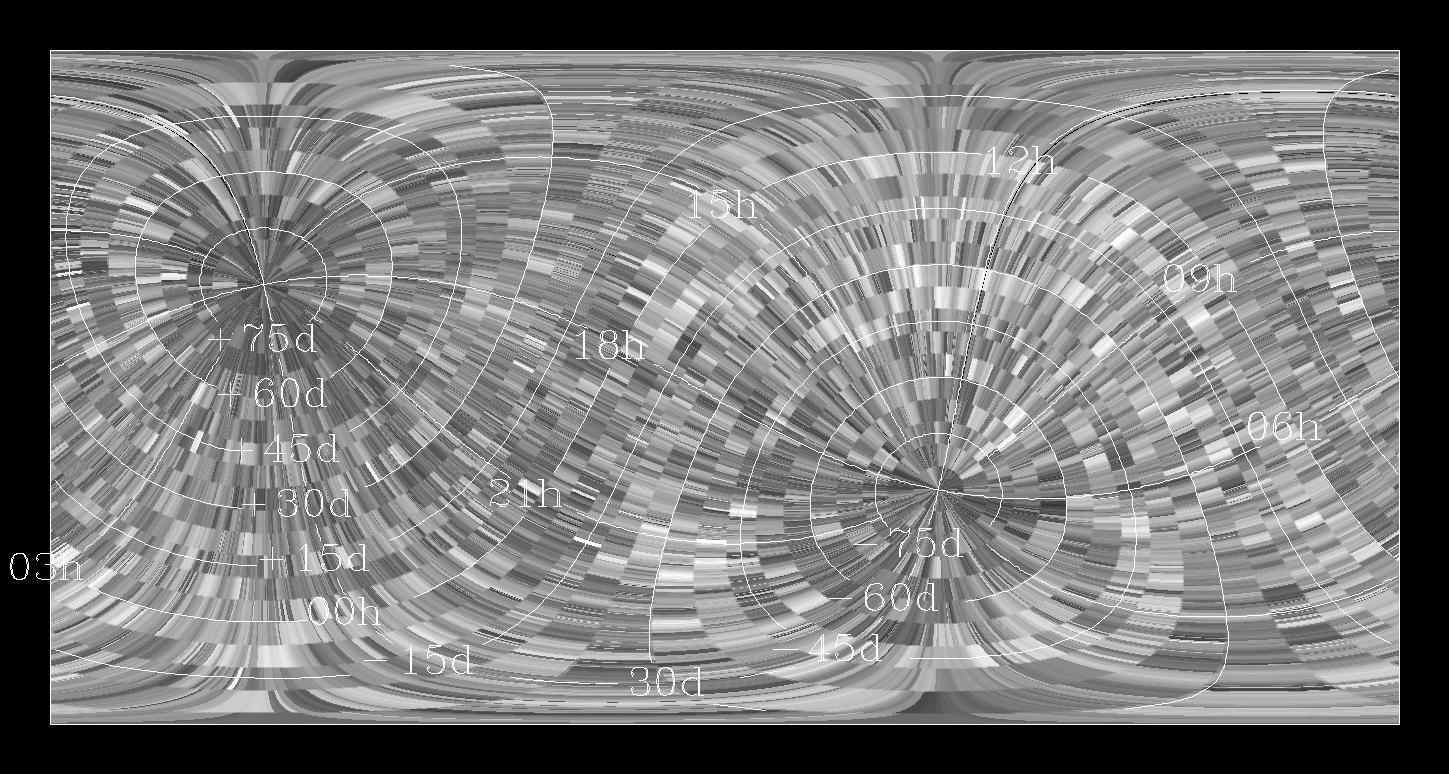 |
| H-band M10:1 - Range: 14.8 to 16.0 mag | |
 |
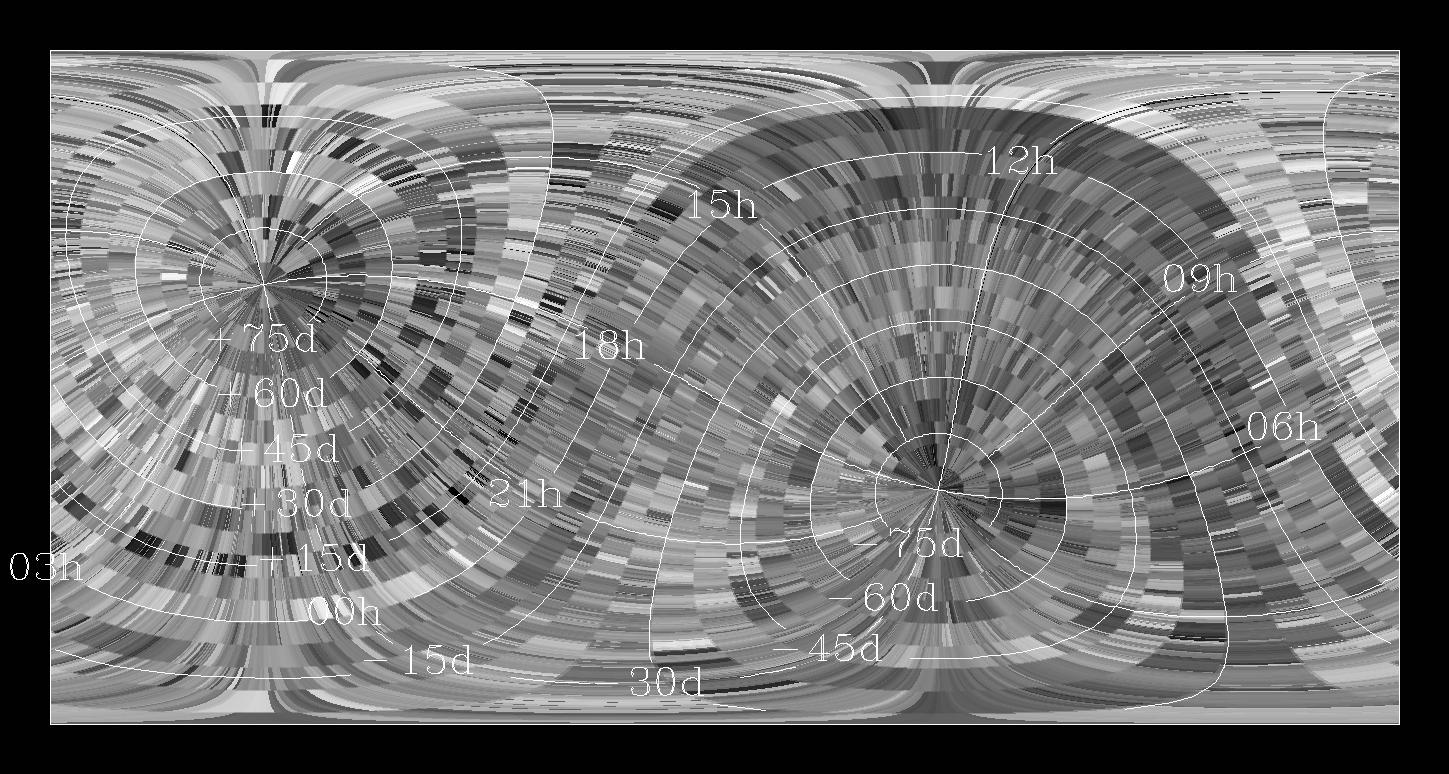 |
| Ks-band M10:1 - Range: 14.3 to 15.3 mag |
Statistics
The minimum, maximum, mean and standard deviation of the achieved sensitivity for all Tiles in each band are given below.
    min      max      mean    sigma
J  15.787   16.951   16.422   0.135
H  14.821   16.044   15.484   0.175
K  14.264   15.340   14.808   0.162
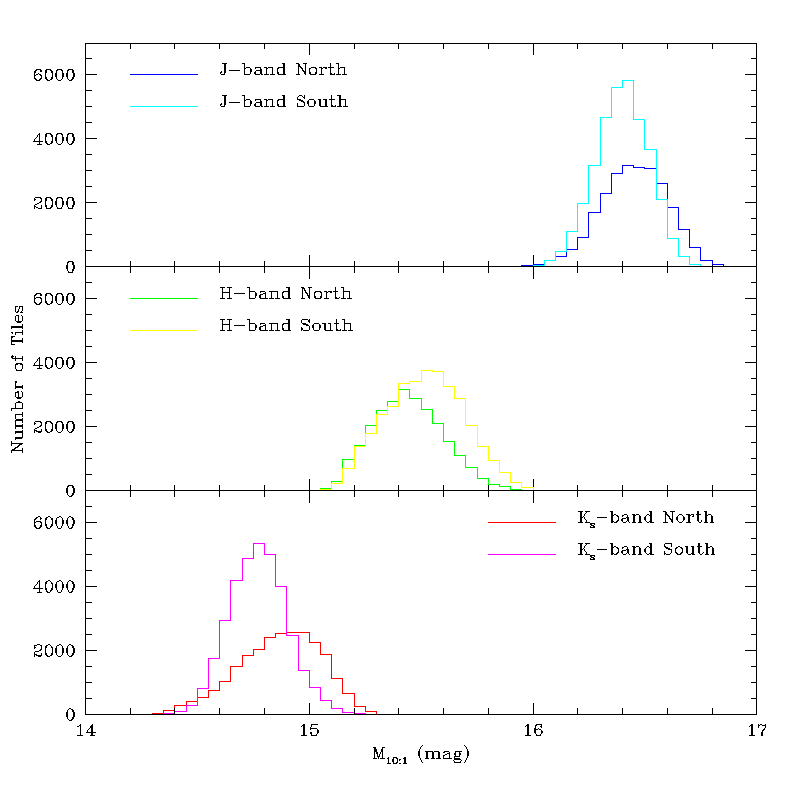
The Figure below shows histograms of the north and south sensitivities. In the J-band, the average north sensitivity was better than in the south, but the spread in sensitivity is comparable for both observatories. The southern H-band measurements are better than those from Mt. Hopkins. This is biased at least in part by the replacement H-band array installed in the Mt. Hopkins camera in July 1999. This array was nearly 30% less sensitive than the original array, but only 10% less sensitive than the CTIO H-band array. Ks sensitivies were better on average at Mt. Hopkins, but again the range of sensitivies was similar. The Ks sensitivies were a strong function of season at both observatories, as is shown in this Figure, in which the Ks sensitivity is plotted as a function of Julian Day for both observatories.
 |
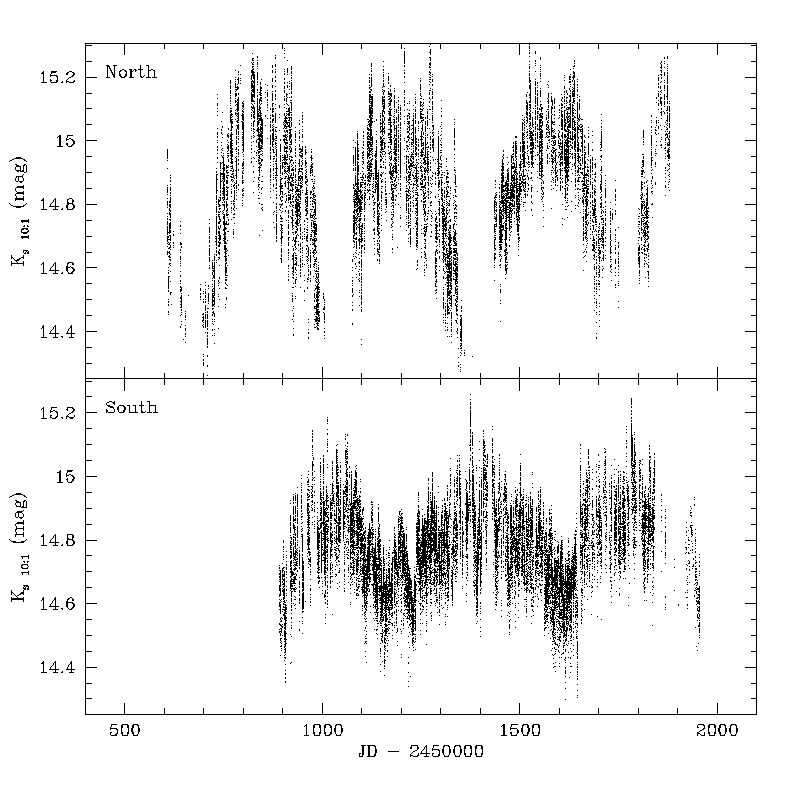 |
| Histograms of northern and southern sensitivity | Ks sensitivity vs. JD |
Last Updated: 22 October 2002
R. Cutri, L. Cambresy - IPAC