VI. Analysis of Release Catalogs
7. Galactic Plane Performance: Detailed Analysis
a. Completeness
The nominal photometric completeness limits for the 2MASS Point Source Catalog apply to galactic latitudes of |b| > 30. Near the Galactic Plane (and toward a few globular clusters located at high galactic latitudes), the identification of individual sources is limited by the high overall density of sources, and the completeness limit will occur at brighter magnitudes.
To investigate the completeness limits in the Galactic Plane, J, H, and Ks star count maps were generated in 0.2 magnitude intervals for point sources with magnitudes between 4 and 18 mag and a photometric quality flag of A, B, C, D, or E in the appropriate band. These images can be used to determine the sensitivity of the 2MASS point source catalog as a function of position in the Galaxy. Table 1 contains links to the individual star count images (presented as surface density maps in stars per square arcminute). This table also includes links to animated gifs that cycle through various magnitude bins. The images are displayed in a high dynamic range stretch that shows the entire sky, and a low dynamic range stretch that emphasizes the galactic plane. Each image was binned in 10 x 10 arcmin^2 pixels and are displayed in a Galactic Aitoff projection centered on the Galactic Center, where the galactic longitude increases to the left.
The Galactic Plane is clearly visible in these images as the bright horizontal band. The star count maps show a patchy distribution in the Galactic Plane, especially at J-band, due to extinction from dust within the Galaxy. Beginning at approximately J=14, H=13.5, and K=13, the star count maps start developing holes (as represented by the black regions), first near the galactic center, and expanding to larger galactic latitudes for fainter magnitudes.
The above impressions where quantified by computing, for each 10 x 10 arcmin^2 pixel in the star count maps, the magnitude bin which contains the peak star counts. The magnitude at the peak star counts was taken as a measure of the completeness. Note, however, that this definition of completeness differs from that used to characterize the 2MASS Point Source Catalog, which was defined to be the faintest magnitude bin which recovers 99% of the expected source counts and was measured based on repeated observations of 2MASS calibration fields and overlap regions in the 2MASS survey. The definiton of completeness used here is not as stringent.
In Figures 1-3, the resulting peak magnitudes are plotted versus the stellar density for stars brighter than 12th magnitude. The limit of 12th magnitude was adopted since visual inspection of the images in Table 1 indicates that the 2MASS Point Source Catalog is complete to this magnitude over the entire sky in each band. The color scale in Figures 1-3, normalized such that peak value is unity, indicates the number of pixels in the star count map containing a given combination of stellar density and magnitude. Figures 1-3 show that at low stellar densities (i.e. high galactic latitudes), the magnitude histograms peak at approximately J=16.5, H=15.7, and Ks=15.2. As the stellar density increases, the magnitude histograms systematically peak at brighter magnitudes. For the highest stellar densities, the magnitudes peak at near 13th magnitude for each band, consistent with the visual inspection of the images in Table 1. Images of the peak magnitude as a function of position in the sky are shown in Figures 4-6. The show that the primary areas of incompleteness are at (a) longitudes ± 75 degrees from the Galactic Center and latitudes ± 1 degree from the Galactic Plane, and (b) within approximately 5 degree radius of the Galactic Center. This conclusion is confirmed in Figures 7-9, which show the average peak magnitude as a function of galactic longitude for 6 different galactic latitude intervals. The horizontal dotted line in each panel represents the nominal 2MASS completeness limits. These figures show that the peak magnitude has little dependence on galactic latitude for |b| > 10 degrees.
| Band | Low Stretch | High stretch |
|---|---|---|
| J | X | X |
| H | X | X |
| Ks | X | X |
|
|
|
|

|

|

|
| Figure 1 | Figure 2 | Figure 3 |

|

|

|
| Figure 4 | Figure 5 | Figure 6 |

|

|

|
| Figure 7 | Figure 8 | Figure 9 |
b. 2MASS Colors toward the Galactic Center
Figure 10 shows an image of the average H-Ks color for 2MASS Point Sources toward the Galactic Center with Ks <=14.3. The colors were computed using the default 2MASS magnitudes, which for most sources represents photometry computed by fitting a Point-Spread Function to the 2MASS images. The high extinction associated with the Galactic Plane is clearly visible as the horizontal band of red H-Ks colors.
At high galactic latitudes, one discerns a rectangular grid pattern to the distribution of H-Ks colors. These grids correspond spatially to the individual coadded images in the 2MASS Image Atlas, and indicates that the 2MASS data processing has introduced a color bias to the J, H, and Ks photometry.
Figure 11 shows a similar image of the average colors, but where the colors were computed using the aperture magnitudes. (This figure contains many individual pixels where the colors deviate from the surrounding average, which reflects the inherent difficulty in performing aperture photometry in source-confused regions.) The rectangular grid pattern is no longer evident when using the aperture magnitudes, and suggests that the color biases seen in Figure 10 are due to errors in the Point Spread Function (PSF) photometry.
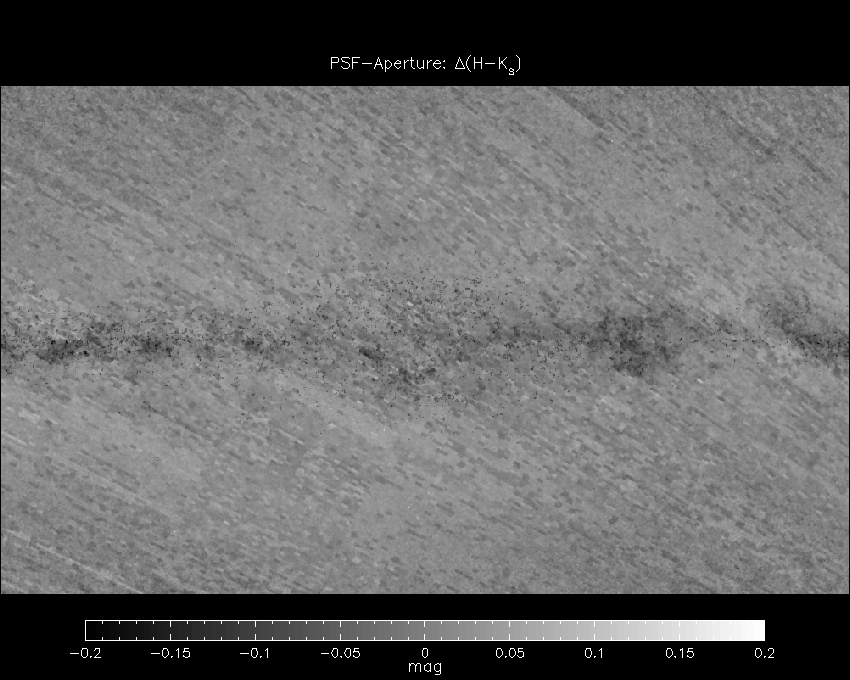
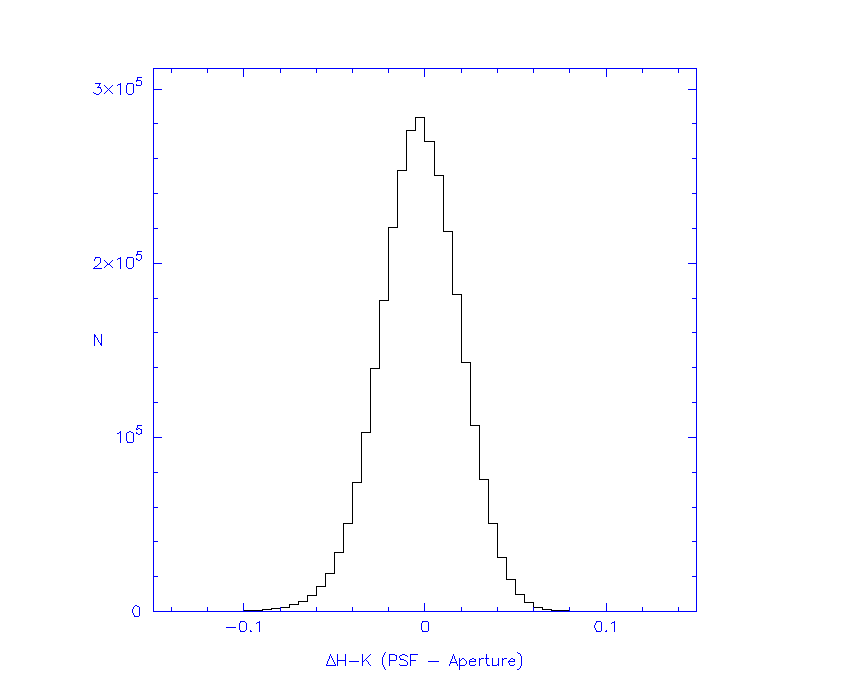
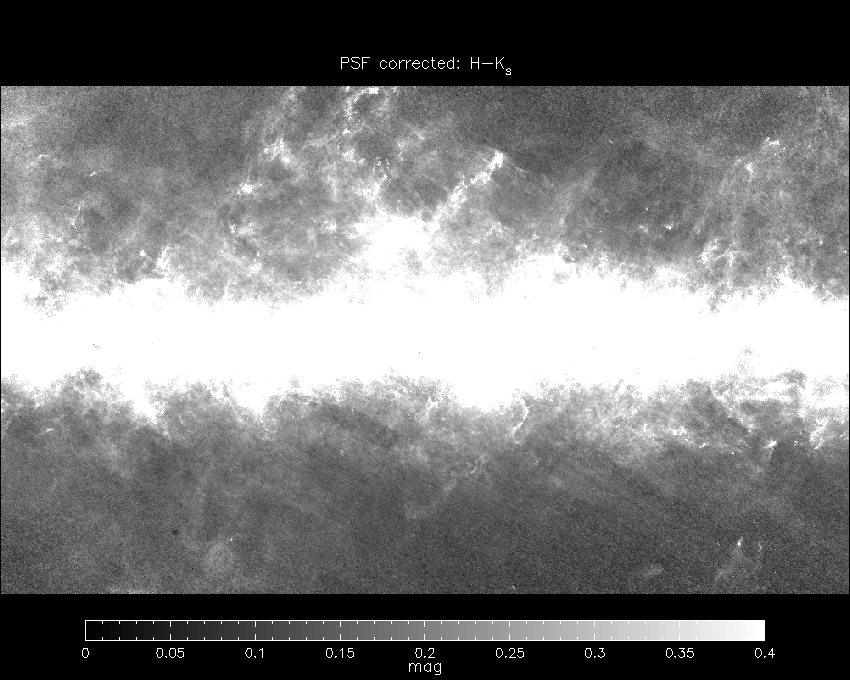
To quantify the amplitude of the color bias, the color map computed with aperture photometry was subtracted from the PSF map. To remove the highly deviant pixels in the aperture color map, the difference image was median filtered with a 3x3 pixel box and using only pixels with color differences less than 0.25 magnitudes. The difference image (see Figure 12) clearly shows the grid pattern found in the PSF photometry map. A histogram of the color differences for galactic latitudes |b| > 1 degree (Figure 13) indicates that the RMS of the color bias in the difference image is 0.022 magnitudes. The difference image was used to apply a first order correction to the PSF photometry. The resulting H-Ks image (see Figure 14) can be directly compared to the original image (Figure 10) and shows that the amplitude bias has been substantially reduced.
Analysis of the PSF photometry suggests that the origin of the color bias can be partially attributed to a PSF grid that did not adequately sample the range of seeing conditions over the course of the 2MASS survey. However, even after correcting for the mis-matched PSF, there appears to be residual color biases which are not understood. These color biases should be present at all galactic latitudes, but are only clearly seen toward the Galactic Center where the counting statistics are sufficient to detect the few percent bias.
| PSF | Aperture | PSF-Aperture | Delta(H-Ks) Histogram | Empirical correction |
|---|---|---|---|---|

|

|

|

|

|
| Figure 10 | Figure 11 | Figure 12 | Figure 13 | Figure 14 |
c. Astrometry
Figure 15 and Figure 16 show images of the average major and minor axis astrometric uncertainty, respectively, for point sources brighter than Ks=14.3. There are several distinct patterns in the spatial distribution of astrometric uncertainties. First, the uncertainties increase toward the declination edges of the 2MASS tiles where the astrometric solution is bounded by in only one direction. Higher astrometric residuals are also seen toward the equatorial and galactic poles. Near the Galactic Plane, the typical quoted astrometric uncertainty is approximately 0.06 arcseconds for both the major and minor axis. Within approximately 60 degrees of the Galactic Center and 1 degree of the Galactic Plane, the astrometric uncertainties increase to ~ 0.075 arcseconds for both axes.
| Major axis | Minor axis | |
|---|---|---|

|

|
|
| Figure 15 | Figure 16 | |

|

|
|
| Figure 17 | Figure 18 | |
d. Magnitudes limits at SNR=10
For a given magnitude, a source in the Galactic Plane will generally have lower signal to noise due to the added contribution of confusion noise. To estimate the decrease in the signal-to-noise due to confusion noise, the average magnitude of sources with photometric uncertainties between 0.105 and 0.115 (corresponding to a signal to noise ratio between 10.3 and 9.4) was computed as a function of position on the sky.
Figures 19, 20, and 21 show the spatial images of the average J, H, and Ks magnitudes respectively within the 0.105 to 0.115 uncertainty interval. Further, Figures 22, 23, and 24 plot the average magnitudes in these images as a function of Galactic Longitude for different galactic latitude bins, where the dotted lines represent the nominal 10-sigma sensitivity limits of the 2MASS survey. These figures shows that over most of the sky, the average magnitude for a SNR=10 source is fainter than the nominal 2MASS limits. Within ~6 degrees of the Galactic Center, however, the the SNR=10 magnitude limit can be up to 2 magnitudes brighter than the nominal 2MASS limits due to confusion noise. In addition, within 1-3 degree of the Galactic Plane and approximately 60 degrees of the Galactic Center, the SNR=10 magnitude limits occurs at a brighter magnitudes than most of the sky by up to 1.5 magnitudes.
To further characterize the effects of confusion noise, Figures 25, 26, and 27 show the average photometric uncertainty for sources at J=15.9, H=15.1, and Ks=14.3 respectively. These averages were computed in 0.2 magnitude intervals centered at the above magnitudes. Figures 28, 29, and 30 show plots of the average magnitudes as a function of galactic longitude for different galactic latitude bins, where the dotted lines represent the nominal 10-sigma magnitude limits of the 2MASS survey. These figures confirm the results from the previous section in that the photometric uncertainties are increased to ~ 0.11 mag for point sources within 1-3 degrees of the Galactic Plane and between -65 degrees and +50 degrees of the Galactic Center.

|

|

|
| Figure 19 | Figure 20 | Figure 21 |

|

|

|
| Figure 22 | Figure 23 | Figure 24 |

|

|

|
| Figure 25 | Figure 26 | Figure 27 |

|

|

|
| Figure 28 | Figure 29 | Figure 30 |
e. Area masked by bright stars
Bright stars in the 2MASS survey produce diffraction spikes and confusion halos that can generate false point source and extended source detections. These artifacts were removed from the public release catalogs by masking out an area around bright stars. The area masked depends on the magnitude of the star and is different for the J, H, and Ks bands. Figures 31-33 show images of the area masked in 10'x10' pixels. These calculations are only approximately in that they convert the irregular shaped diffraction spikes into an equivalent sqaure area. As expected, most of the masked area is associated with bright stars found in the Galactic Plane.
| J | H | Ks |
|---|---|---|

|

|

|
| Figure 31 | Figure 32 | Figure 33 |
[Last Updated: 2003 March 31; by J. Carpenter]