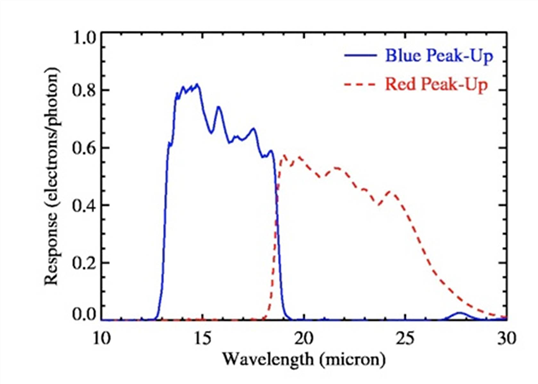
Red and blue peak-up images are obtained simultaneously on the SL detector. The field-of-view seen by each filter is 54x81 arcsec2, and they are separated by a 33 arcsec wide vignetted zone (see Figure 2.2). The images are 35x45 pixels2 in size and have a plate scale of 1.85 arcsec/pixel in the detector X direction, and 1.82 arcsec/pixel in the detector Y direction. The position of the two images on the SL detector is an accurate representation of their position on the sky; that is, the two fields-of-view together with the vignetted region see a contiguous 54x195 arcsec2 area. A single WCS can be used to describe the combined red and blue regions within the 128x128 pixel detector. The geometric distortion has been accurately mapped and found to be small. The magnitude of the distortion causes no more than 1/2 pixel shift at the edge compared to the center of either peak-up array field-of-view. The distortion coefficients are applied to the astrometric solution in the World Coordinate System (WCS) provided in the FITS header of the pipeline-processed data. The system’s response is shown in Figure 2.8.
Figure 2.8: PUI response functions, in electrons/photon. This is the product of the detector’s responsive quantum efficiency (QE times photoconductive gain) and the filter transmission.
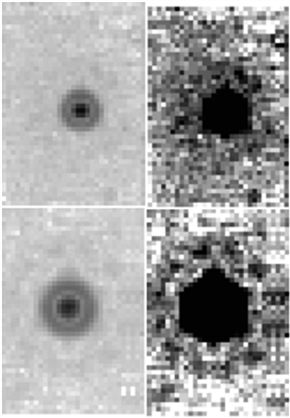
The IRS provides diffraction-limited images through both peak-up filters (see Figure 2.9). The full-width-at-half-maximum (FWHM) of the PSF is approximately 2 pixels (3.8 arcsec) in the blue filter, and approximately 3 pixels (5.3 arcsec) in the red filter. The radius containing 50% of the encircled energy is 1.6 pixels (3.0 arcsec) in the blue filter, and 2.2 pixels (3.9 arcsec) in the red filter. These numbers were derived for stellar (blue) sources.
Figure 2.9: PUI PSFs for the blue (top) and red (bottom) apertures. These PSFs are co-additions of several high signal-to-noise stellar images placed within 0.1 pixels of one another on the array. The images on the left are stretched to show the central PSF and the first diffraction ring; the images on the right are stretched to show the second diffraction ring. These images show the full fields of view of the peak-up arrays.