8.2.6 Example: 70 micron faint point source survey
In this section, we describe how to reduce 70 micron data when you are interested in faint point sources. See also a graphical representation of this process in Figure 8.6.
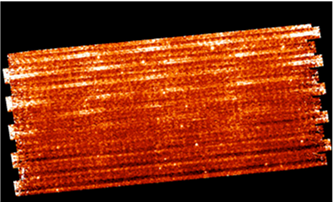
Figure 8.7 shows a mosaic from one AOR of the extragalactic FLS verification field. It is made from the non-filtered 70 micron BCD products. The dark (horizontal) stripes at the bottom of the image are due to the variation of the residuals in the slow response. The bright (vertical) stripes at the top are due to stimflash latents.
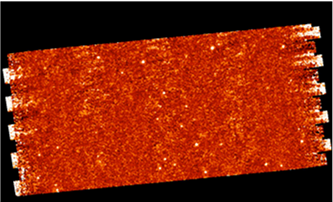
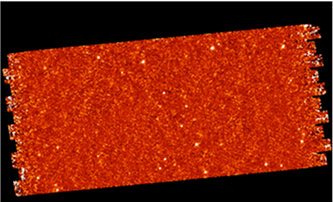
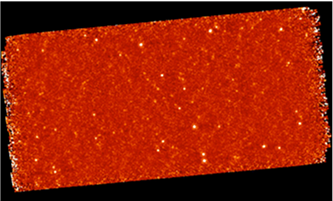
Figure 8.8 shows a mosaic of the time-filtered BCDs (e.g. the *fbcd files). The drifts of the slow response and the majority of the stim latent artifacts are removed using the temporal filter data. While filtering scan data, point source calibration is maintained to within measurement errors. Figure 8.9 shows the results with only the column filter, while Figure 8.10 shows the results for 4 AORs after application of both filters.
Figure 8.7: Step 1: mosaic of initial default 70 micron scan BCDs (1 AOR) from the extragalactic First Look Survey. Stim latents (white horizontal streaks) and slow response residuals (dark horizontal streaks) are apparent; see text.
Figure 8.8: Step 2: mosaic of time-filtered 70 micron scan BCDs for 1 AOR. Variations due to slow response residuals have been corrected, though stim latents are still visible.
Figure 8.9: Step 3: mosaic of column-filtered 70 micron scan BCDs for 1 AOR.
Figure 8.10: Step 4: mosaic of 4 AORs processed with both column and time filter.