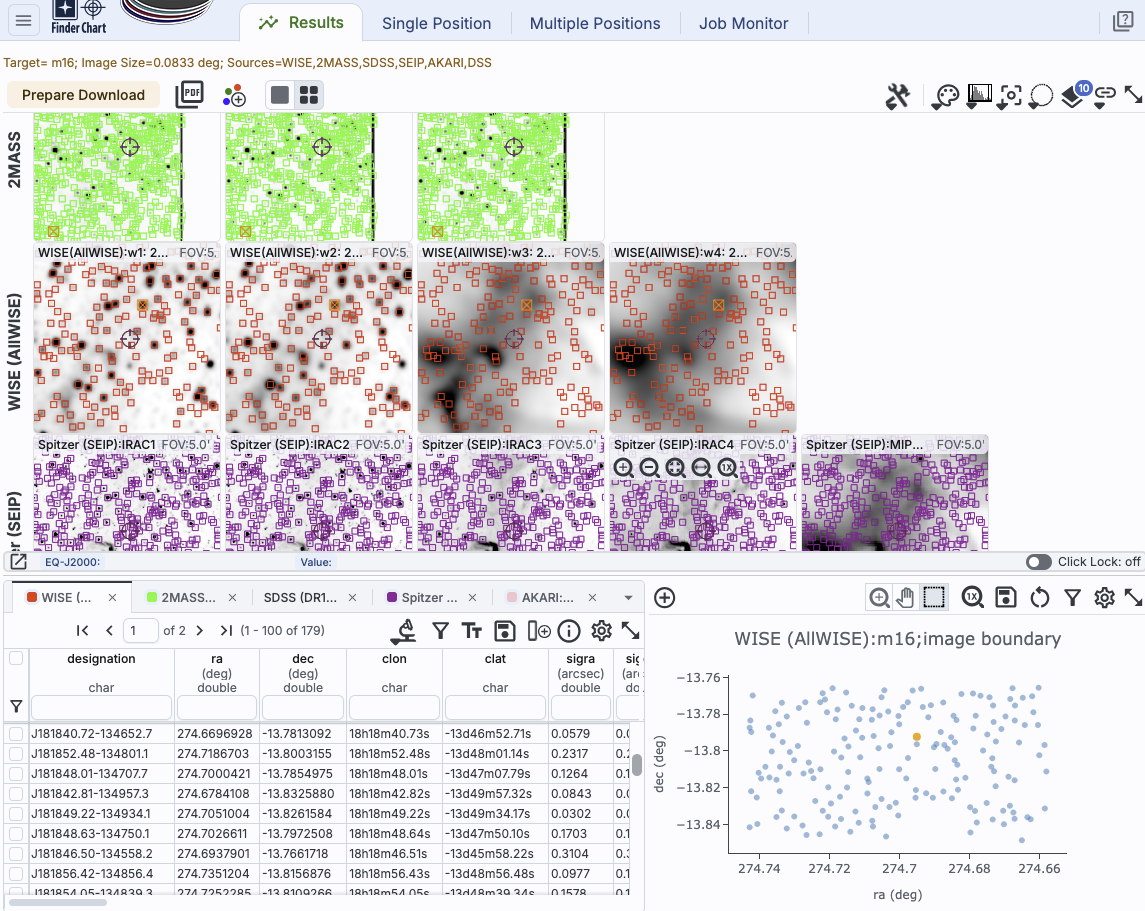
This is an example Finder Chart results screen, which we now discuss.
⚠ Tips and Troubleshooting
Along the top of the images, there are several notations.

Your search is summarized succinctly at the top.
 The "Prepare Download" button
initiates the data download process.
The "Prepare Download" button
initiates the data download process.
 The "PDF" button is another kind of data download, where it makes a PDF of the
search results.
The "PDF" button is another kind of data download, where it makes a PDF of the
search results.
 This icon adds a 3-color image at the end of each
row, where the constituents of the image come from that row.
This icon adds a 3-color image at the end of each
row, where the constituents of the image come from that row.
![]() This icon controls whether you view one
image at a time (left icon) or many images at once (right icon).
This icon controls whether you view one
image at a time (left icon) or many images at once (right icon).
All of the basic visualization tools are available to interact with the images.
⚠ Tips and
Troubleshooting When the 2MASS survey was concluded and final
tiles generated, internet (and computers) were much slower, and as a
result, the final image tiles are small. Therefore, when you request
2MASS images, you may very well run into edges of tiles, as in the
screenshot above where the 2MASS data appear to 'end' on the right
hand side before the WISE or Spitzer data do. There really are 2MASS
data over essentially the entire sky, and the tool is doing the best
it can to get you the best possible tile given the position and size
you requested, but you may very well run into an edge of a tile. If
you really need a larger contiguous fraction of sky from 2MASS, try
the IRSA Viewer ![]() tool, and use the "6 degree"
(not 6x, but 6 degree) 2MASS images.
tool, and use the "6 degree"
(not 6x, but 6 degree) 2MASS images.
If you opted to have catalogs returned, the lower left pane is a table with tabs for all of the catalogs meeting your search criteria; the catalogs are also overlaid on the images. If you pick a different row in a catalog of search results, that target is highlighted on the images.
If you did a multi-target search, the upper left pane is a table of your input target list, with all the same capabilities as other tables in this tool. If you pick a different row in a search target list, the images update to reflect that search target choice.
However, if you choose to retrieve catalogs over the whole image, or you search for more catalogs, the plots are more interesting even in their default ra/dec state. You can make more sophisticated plots in this tab.