PTF Image Service: Visualization
Contents of page/chapter:
+Overview
+Basic FITS Viewer
+Visualization Tools -- Image Options
+Breaking out of the pane (and going back)
Once a search is complete, the images meeting your search criteria are
shown on the left, and correspond to the results of the search on the
right, one row per exposure id (expid) in Level 1 and one row per rfid
in Level 2 (only available as proprietary data). Clicking on different
rows on the left changes what is shown on the right. The overlaid blue
circle is the search position you submitted.
You can overlay catalogs and add other layers to your image (such as
2MASS glint artifacts). Click on the blue "Catalogs" tab near the top
of the page to initiate this process. See the
catalogs section for more on catalogs, including how to make plots.
Note that the sky coverage of the displayed images overlaid on an IRAS
100 um map is shown under the 'coverage' tab.
Note that all the images that are displayed are FITS files, not JPGs
or PNGs, so you can interact with them using the tools described
below.
All of the interactive image visualization tools work the same basic
way, and here we describe these basic options, in roughly the order
in which you might encounter them in the window.
- Interactive exploration of the image with the mouse.
- Move your mouse over any image that is loaded into the viewer.
Details about the image and, specifically, the pixel beneath your
mouse cursor, appear along the top of the window with a variety of
useful items. Some information is updated in real time (such as
coordinates); some information (such as flux densities) is updated
when you stop moving your mouse for a second or two. The image can be
interactively investigated in this fashion.

You can make it 'stick' on a
particular place on the image -- tick the "Lock by click" box and then
click on the image at your desired location.
The orientation of the image is given with a compass rose on the
right, next to a zoomed-in view of the image under your cursor. If you
can't see all of these two windows, enlarge your browser window
slightly.
- Finding out more about the displayed image.
- The results are grouped by survey. It indicates the survey origin and the date of
observation (instrument, channel, and date in black, on the top of
each image).
Some of this information (like the title of the image) is also given
in the interactive exploration region described immediately above.
This region also includes additional information about the image (such
as the pixel scale and orientation).
There is a toolbox along the top of the IRSA Viewer window:

from which you can select a
variety of options, now described. Letting your mouse hover over any of
these icons will result in a "tool tip" that appears in order to
remind you what the icon does. This information is also dynamically
updated just to the right of the toolbox itself.
 Saving the image.
- The diskette icon will allow you to save the current image as a
FITS or PNG or Regions file to your local disk. Note that you
control where the file is saved on your disk through your browser;
your browser may be configured to store all downloads in a particular
location on your disk.
Saved FITS images will not save the color stretches or overlays; it
will just save the underlying FITS image. Saved PNG files WILL
include any overlays or annotations you have placed on the image, but
will not include the underlying FITS image. Saved regions files will
not save the underlying image, but will just save the overlays as a
DS9 Regions file. See the DS9 website  for more information on the syntax of
these DS9 region files.
for more information on the syntax of
these DS9 region files.
Note that you can save the original or a cropped version of the
FITS file; see the select region icon below to crop, and then save the
FITS image.
Note also that if you overlay a catalog
consisting of tens of thousands of sources, to save bandwidth, what is
overlaid on your image at some locations may be a larger symbol
representative of several sources at that location; if you save a
regions file from the catalog overlay, then you will have fewer
sources in the regions file than you have in the full catalog.
 Zooming in or out.
-
Clicking on these magnifying glass icons zooms in or out of the image.
The readout of how many times you are zoomed appears at the top of the
visualization window.
If you click zoom in or out rapidly, a pop-up window appears to allow
you to more rapidly select the zoom level you want. Select the desired
level, or click on the blue 'x' in the upper right to make the window
go away. Here is an example:

Note that there is a maximum (or minimum) allowed zoom level. A
notification will appear when you have reached the maximum (or
minimum) allowed zoom level for a given image. To enlarge things more
than that, please repeat your search to obtain new images with smaller
(or larger) spatial extent.
 Zooming to a 1-to-1 size.
- Clicking this icon will zoom the image such that one pixel in the
image is one pixel on your screen.
 Fit image to screen or fill
screen
Fit image to screen or fill
screen
-
These two icons are designed to maximize the available space in your
browser window. The first one automatically picks a zoom level such
that the image entirely fits within the available space. The second
one automatically picks a zoom level such that the image fills as much
of the available space as possible (e.g., it is zoomed such that short
axis of the window is filled with the image, whether that short axis
is left-right or up-down).
By default, the images that are returned are frequently but not always
centered on your search target. Clicking on these icons let you see
the whole image that is returned, whether or not it is centered on
your target.
 Changing the color table.
- This icon enables you to change the color table of the
displayed image. When you click the button, a drop-down menu appears
with a wide variety of color table choices. Select your new color
table from the options shown:

 Changing the color table
stretch.
Changing the color table
stretch.
- This icon enables you to change the color table stretch of the
displayed image. When you click the button, a drop-down menu appears
with a variety of choices. You can choose from a set of pre-selected
options:

If you pick the
first one, "color stretch", you can customize the stretch. A pop-up
window appears with a histogram of the values in the image, and you
can change the stretch type and range.

If you pick a color stretch from the
pre-defined options, the pop-up window reflects this change. (Ex: pick
'Linear stretch to 99%'. Go back to "color stretch". Note that it has
filled out the stretch type and ranges to reflect the current choice.
Then -- either with the pop-up window still up or not -- go back and
pick a different pre-defined stretch from the standard options. Note
that the values in the pop-up change to reflect this current
choice.)
 Rotating the image to any
angle
Rotating the image to any
angle
- This feature allows you to rotate the image to any angle of your
choice, in degrees. It will rotate the image counter-clockwise (to the
left) from the current view, not necessarily the original image. For
example, entering "45" in the rotation pop-up and hitting "rotate"
will rotate the image 45 degrees counter-clockwise relative to its
original orientation. Then selecting the icon again, and entering
"180" in the pop-up (followed by hitting "rotate") will rotate the
image an additional 180 degrees counter-clockwise. To exit the pop-up
without making further changes, hit the blue 'x' in the upper right of
the pop-up.
 Rotating the image so that North is
up.
Rotating the image so that North is
up.
- Images retrieved from FinderChart are commonly already oriented
such that North is up, or close to it. However, when interactively
investigating images, or in certain situations, you could find
yourself in a situation where North is not necessarily up. Clicking
this icon will orient the selected image so that North is up.
 Flipping the image on the y-axis.
- Clicking on this icon flips the image on the y-axis.
 Re-center the image.
- Clicking this icon will re-center the image on the center of the
last query, or on the center of the image.
 Selecting a region.
- When you click this icon, at first, nothing seems to happen.
(There is a notice with brief instructions that appears on the lower
left of your browser window.) You can now click and drag in the
image, selecting a box on the image. This box can be resized by
grabbing and dragging the corners of the box. You can make a new box
right away by holding down the shift key and clicking and dragging to
select a new box. When you have selected a region of the image,
additional icons appear above the image:
 These icons will allow you to (from left
to right) crop the image to the selected region, obtain statistics on
the region, select the catalog sources overlaid on the image within
the region, or filter the overlaid catalog down to the enclosed
sources. (The last two options will only appear if you have a catalog
overlaid.) You can save the cropped FITS image via the save icon
(described above). The statistics option results in a pop-up that
looks something like this:
These icons will allow you to (from left
to right) crop the image to the selected region, obtain statistics on
the region, select the catalog sources overlaid on the image within
the region, or filter the overlaid catalog down to the enclosed
sources. (The last two options will only appear if you have a catalog
overlaid.) You can save the cropped FITS image via the save icon
(described above). The statistics option results in a pop-up that
looks something like this:

Selecting sources highlights them in the catalog list. When you
impose a filter, the filters icon changes above the catalog to
indicate that there is a filter applied (in this case just one filter:
 ). To clear the filters, click on
the cancel filters icon (which also appears after you impose filters):
). To clear the filters, click on
the cancel filters icon (which also appears after you impose filters):
 .
.
 Measuring a distance.
- When you click this icon, at first, nothing seems to happen.
However, you can now click and drag to draw a line on the image, and
the length of the line is displayed (in the middle of the line). The
units for the measured distance (and the color of the overlay) can be
changed from the "layers" icon (described below). You can
calculate the difference in RA and Dec separately via the layers icon
as well; find the layer associated with the distance measurement and
tick the "offset calculation" box. When it displays the offset
calculation, it will give you the angle in degrees in one corner, and
the length of the line segment in the RA and Dec directions, in the
units you have specified.
 Put a marker on the image.
- When you click this icon, you can now mark a position in the
image. A red circle appears that can be resized and dragged (or click
to move it) to any location in the image. You can change the color of
the marker (and add a label to it) via the "layers" icon
(described below).
 Show the directions of North and East
- When you click this icon, arrows appear on the image showing
which direction is North and which is East.
 Add a coordinate grid.
- Click on this icon to overlay a coordinate grid on the image.
Click it again to remove it. Customize the units of the grid (to,
e.g., Galactic coordinates) via the "layers" icon (described
below).
 Read in a DS9 Regions file
- When you click this icon, you get a pop-up window from which you
can read in a DS9 regions file from your local disk. See the DS9 website for more information on the syntax of
these DS9 region files. The supported regions are text, circle, box,
polygon, line, and annulus. To make this window go away without doing
anything, click on the blue 'x' in the upper right of the pop-up.
 Viewing/changing the layers on the
image.
Viewing/changing the layers on the
image.
- If you've been following along by trying these various options,
you now have an image with a lot of annotations on it. The number that
appears in blue over the layers icon tells you at any given time how
many layers you have on the currently selected image. If you click
this icon, you will get a pop-up window with a list of all the layers
you have on top of the image. From the pop-up, you can turn layers off
and on, at minimum, but you can often also change exactly what is
displayed and what colors get used for it. To add new things, though,
you need to go to other options within the toolbar. Here is an example
of a well-populated layers pop-up.

To change colors of a layer, click on
the 'colors' link to be taken to a new pop-up from which you can
select a new color. To delete a layer, click on 'delete'. Some layers
appear do not have that option; to remove that layer, click on the
corresponding icon from which you added that feature. To make this
pop-up window go away, click on the blue 'x' in the upper right of the
pop-up.
 Restoring everything to the
defaults
Restoring everything to the
defaults
- If you've played around a lot with the image, you may want to undo
everything you've done. Click this button to restore everything to
their original default values. Some layers may persist; remove them
via the layers icon described above.
 Viewing the FITS header.
- This icon will display a pop-up window with the FITS header of the
background image. If you click on the columns of the FITS header in
the pop-up, it will sort the keywords alphabetically by that column.
This is useful for finding individual keywords in particularly densely
populated FITS headers. Click the header again to sort in
reverse-alphabetical order, and a third time to return to the default
order. Here is an example of a sorted FITS header. Note that the first
column is the original order of the keywords. To make it go away,
click on the blue 'x' in the upper right of the pop-up.

 Getting help.
- Clicking on this icon takes you to this help page.
The visualization toolbar associated with the image displayed in the
coverage pane contains two additional icons that appear near the
middle of the toolbar:
 Select a new image.
- Clicking on this icon allows you to select a background image
from a variety of surveys, e.g. 2MASS, DSS, etc.
Breaking out of the pane (and going back)
By default, the search results are broken up into panes. For some
purposes, it is useful to view the images (or the table) as large as
possible. On the upper right of either the image pane (or the table
pane), there is an expand icon  .
Clicking on it will expand the images (or table) into a larger window,
with the selected image appearing first. From this view (with the
images), you now have some additional options that appear near the top
of the new window.
.
Clicking on it will expand the images (or table) into a larger window,
with the selected image appearing first. From this view (with the
images), you now have some additional options that appear near the top
of the new window.

The large "Close" arrow at the left enables you to return back to the
pane view. This arrow is always available in these expanded views.
Next, the currently displayed band (sometimes using abbreviations) and
magnification factor is shown. Zoom in or out using the visualization
toolbox described above.
Next, there is a cluster of icons  that
portray (in icon form) the different views you can have of the images
you have loaded. The first icon (the big square) denotes "show one
image at a time." The second icon (the cluster of four squares)
denotes "show smaller images of all the images I have loaded, but
still take up the whole browser window with the set" (as opposed to
going back to the window panes). Depending on what you have been
doing in your session to this point, you may have more than one image
loaded, plus a plot from the catalog. Perhaps you wish to see, e.g.,
just two of the images tiled? Click on the last, blue "list" icon in
this cluster to bring up a pop-up window:
that
portray (in icon form) the different views you can have of the images
you have loaded. The first icon (the big square) denotes "show one
image at a time." The second icon (the cluster of four squares)
denotes "show smaller images of all the images I have loaded, but
still take up the whole browser window with the set" (as opposed to
going back to the window panes). Depending on what you have been
doing in your session to this point, you may have more than one image
loaded, plus a plot from the catalog. Perhaps you wish to see, e.g.,
just two of the images tiled? Click on the last, blue "list" icon in
this cluster to bring up a pop-up window:

This popup window lists all of the
images you have loaded, and if you uncheck the corresponding box, that
image, while it is still loaded, will not be shown if you, say, scroll
through the images, or look at them in tiled mode.
If you do have more than one image loaded, you may also have, on the
top right of the image, a set of arrows, labels, and green/blue dots
(which only appear when you are viewing one image at a time and have
more than one image loaded).
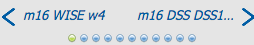
These allow you to navigate through your set of images. The green dot
inamongst the blue dots indicates where you are in the sequence of
images, and the arrows and labels indicate which image is before or
after the currently viewed image. Click on the arrows or the dots to
move around in the sequence.