SOFIA Science Data Archive: Images
SOFIA data includes many FITS  images, but the SOFIA Archive provides HiPS
images for context setting. This chapter covers some basics about
images, including an introduction to HiPS images and coverage images;
visualization tools are covered in
another chapter.
images, but the SOFIA Archive provides HiPS
images for context setting. This chapter covers some basics about
images, including an introduction to HiPS images and coverage images;
visualization tools are covered in
another chapter.
Contents of page/chapter:
+Introduction
+HiPS Images: General Information
+Coverage Image
+Upper Left HiPS menus
There are basically two kinds of images you can find in the SOFIA
Archive, FITS and
HiPS . More
information about HiPS is in the next section below.
FITS images you may be most familiar with have a header and an image.
But FITS images can be far more complicated, and most SOFIA FITS files
are more complicated. A FITS file is a header plus a "data unit", or
an HDU. A single HDU can be an image, a spectrum, a table, or a data
cube. Thus, a single HDU can have multiple data planes. FITS files can
have multiple HDUs, each of which can have multiple data plane. FITS
files can also be a mixture of images and tables and cubes. Many of
the SOFIA high-level data files are multi-plane, multi-HDU, mixed
images and tables in the same file. A description of how to use the
SOFIA Archive to interact with these complicated data files is in the
spectra section, because most of these
complicated files are spectra.
Much more detail about interacting with images in general can be found
in the Visualization section.
HiPS Images: General Information & Definitions
HiPS
stands for hierarchical progressive surveys, and these kinds of images
are multi-resolution HEALPix
images (where HEALPix stands for Hierarchical Equal Area isoLatitude
Pixelation). (Also see IVOA docs on HiPS .) In practice, what this means is that you can
interact with images of a very large chunk of sky, and as you zoom,
the pixel size changes dynamically. HiPS images are fundamentally
different than FITS images, and as such, what you can do with the HiPS
images are different than what you can do with the FITS images.
The whole point of HiPS images is to provide on-demand resolution
changes. Zoom out, and it loads large pixels. Zoom in, and it loads
smaller pixels. HiPS images are designed to cover large areas of sky
efficiently. If you need to visualize many degrees, this is the image
type to use.
There are HiPS images from all over the world available via the web;
the complete list of HiPS images available from the images search
page includes (once the "IRSA Featured" checkbox is unchecked) many
HiPS images from CDS .
HiPS images typically have the color and stretch set by the person who
originally made them. The color table can be remapped within this
tool. But, you cannot, in general, change the stretch of HiPS images
with as much flexibility as you can with FITS images. This is why
there may be multiple versions of some data sets in the list of HiPS
images.
HiPS maps typically come with a Multi-Order Coverage map
(MOC). A MOC is a
format developed by the International Virtual Observatory Alliance to
specify sky regions. In this context, a MOC tells you via a simple
boolean yes/no, is there sky coverage from this data set in this
region. You can overlay a MOC from one data set onto a completely
different data set's HiPS image.
Things that define a HiPS image. When selecting a
HiPS image, the tool gives you a table. The table that appears has
several columns that summarize important things about the available
HiPS images:
- Type - image (all that is available in this context)
- Properties - links to more information for that image
- Title - descriptive words for the HiPS image
- Waveband - Approximate wavelength range
- Coverage - Approximate sky coverage (100% or less) -- HiPS images
often carry with them something referred to as "MOC", or multi-order
coverage. This number gives an indication of the sky coverage of the
data.
- Pixel scale - At the highest order (zoomed in the most), this is
the pixel size
- HiPS Order - HEALPix tile order; without getting into the guts of
HEALPix, this represents how deep you can zoom
- Frame - coordinate sytem, e.g., equatorial, galactic, etc.
- Dataset IVOA ID - Unique (worldwide) identifier for the dataset
The SOFIA Archive provides for you a "coverage image", which is
basically a way for it (and you) to keep track of where you are
working on the sky. This may initially be surprising. There is a
legend that appears in the upper right of the coverage image, and
there is a quick link to the layers icon; see layers section of the Visualization chapter. You can collapse
the legend to make it smaller by clicking on the arrow in the upper
right of the legend box.
| You may have a coverage image like this -- this is
an example of a coverage image showing the results of a search on M42.
The background HiPS image is a 2MASS image. M42 was a very
popular target! The polygons correspond to different images found by
the search; see the legend in the upper right. The orange ones
correspond to the currently-selected ones in each corresponding
instrument tab. There are many more pointings down in the 'murk' in
the center. The circle with crosshairs is the position used for the
search. | 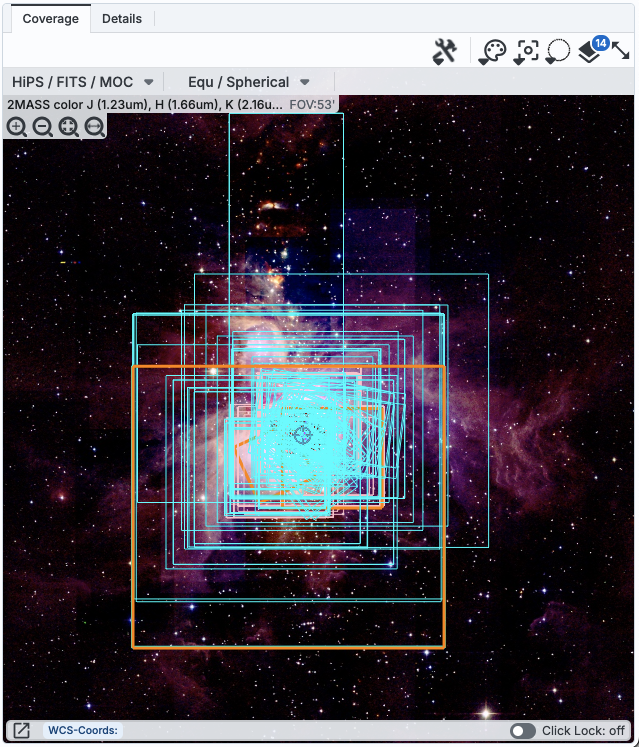 |
| This coverage image is a DSS (optical) HiPS image,
showing a less popular target, M17. The polygons are largely FORCAST
images (one is HAWC+), and the points are FIFI-LS pointings -- see the
legend in the upper right. | 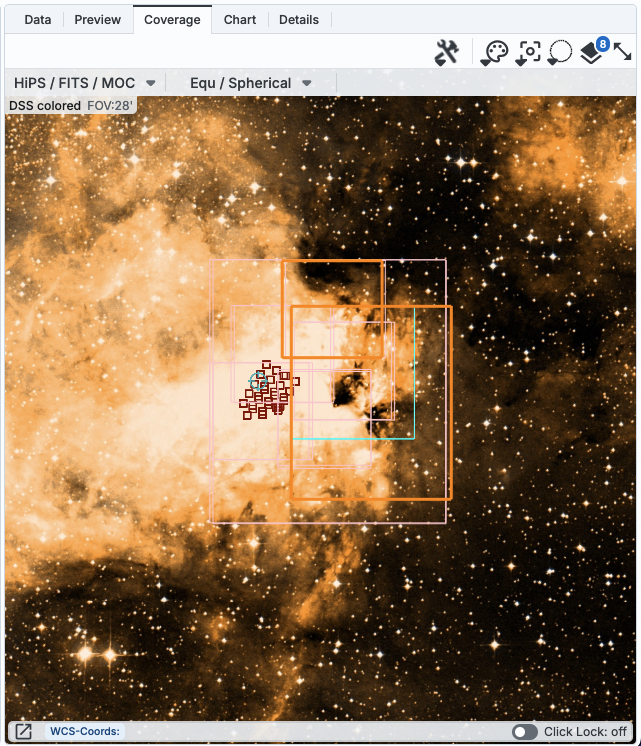 |
| This coverage image is 2MASS again, of M101. There
are polygons for FIFI-LS coverage, a single point for a GREAT
pointing, and many small squares that are point sources from a WISE
catalog overlaid -- see the legend. | 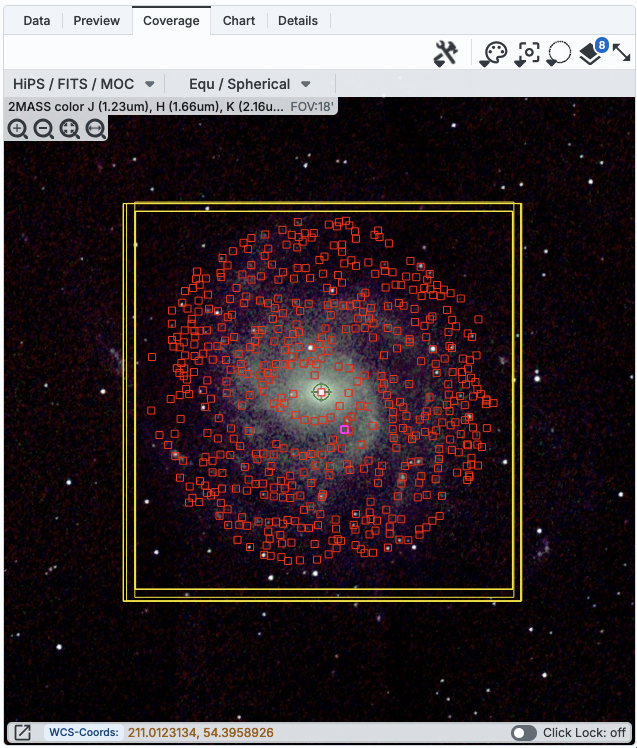 |
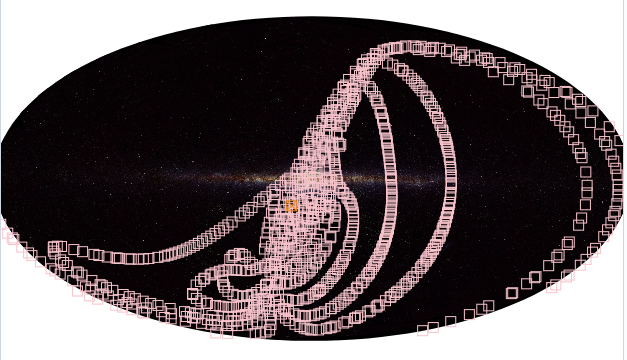
| Finally, this coverage image is IRAC-1, of the
Galactic Center. The larger polygons are HAWC+, FIFI-LS, and FORCAST
coverage; the FORCAST data in particular are from this SOFIA Legacy program . The many-thousand-source Gaia catalog from this
region is overlaid in red. Because there are so many sources in the
catalog, the tool is rendering the catalogs in a hierarchical fashion,
similar to how HiPS images work. What that means is that the tool has
shown the HEALPix cells and the total number of sources in that cell.
I've clicked on three cells so it has rendered the individual sources
in those cells. You can control what this threshold is and how it
renders the cells from the layers
pop-up. | 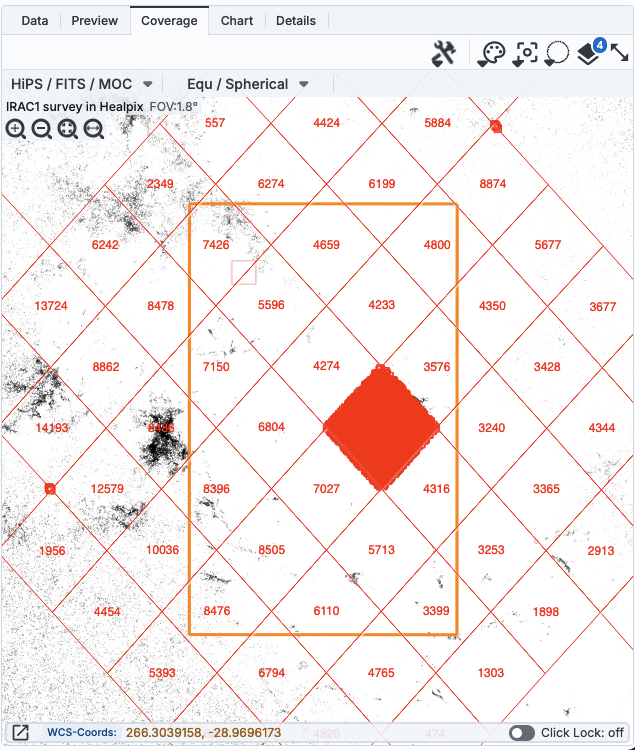 |
In all cases, you can interact with the coverage image in pretty much
exactly the same way as you would any other image loaded into this
tool; see the the visualization
chapter for much more about those tools. The thing that makes a
coverage image a little bit different than any other image you might
load, however, is that it can automatically adapt, even beyond what a
HiPS image can intrinsically do. The next subsection includes more
details about how it can automatically change to accomodate your needs
and zoom level.
⚠ Tips and
Troubleshooting
- When showing the coverage of SOFIA observations, images will be
generally shown as large polygons, but spectra will be represented as points.
- You can change the colors (and symbols) in the coverage image; see
the visualization chapter.
- If there is no color swatch in the header of the instrument tab,
there are no polygons on the coverage image (e.g., no observations
were returned for that instrument).
- The currently selected row will be highlighted orange, but this
only works from instrument tabs; nothing will change in the image if
you change rows in the AOR tab.
- If there are too many image polygons to manage, the tool may fall
back to showing just the positions of the data products it has
retrieved. (Whether that is the central point or the lower left corner
of the image depends on the data product itself.)
- If there are more than 1500 points, the tool may fall back to
using hierarchical catalogs, which
can be confusing.
- If you do a multiple target
search, so that you can more easily tie results to input, when you
get results back from a batch search, the input RA and Dec are columns
appended to the end of your results tables.
- If you have done a search for a Solar System Object, you may also have
a calculated orbit show up on the coverage tab. If you give it a
nearby asteroid with a long time baseline, it can calculate
impressive-looking orbits.
In the upper left of the coverage image, there are two drop-down
menus. The first is covered immediately below; the second is covered
here.
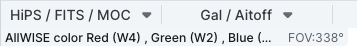
The first drop-down menu looks like this.
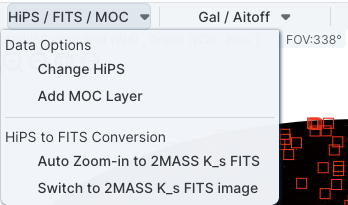
There are two sections here, "Data Options" (see immediately below)
and "HiPS to FITS Conversion."
- Under "Data Options", you can change what data are shown.
-
- Change HiPS: Changing HiPS images
- The choices made by any given creator of a HiPS image may result
in any particular region being saturated or too faint to see. Color
stretches are set by the creator of the HiPS map and cannot be
changed; color tables can be somewhat changed by this tool, but that
may be insufficient for your needs. If the HiPS map as shown does not
suit your needs and you wish to change the HiPS image, click on the
"HiPS/MOC" menu, and then click "Change HiPS". It brings up this
pop-up:

Things to note:
- To select a new image, click on the row corresponding to the new
HiPS image you want, and click "Change HiPS" on the bottom left.
- To cancel without selecting a new image, click "Cancel."
- This is an interactive table, so all the filtering and column manipulation tools apply here
too. You can filter down the columns to find the image you want to
use.
- To learn more about each HiPS map, click on the i with the circle
in the second column. It will spawn another window with standardized
information about the HiPS map.
- By default, it shows HiPS maps corresponding to IRSA data
collections. To see a more comprehensive list, unclick the box marked
"IRSA Featured."
- A blank HiPS image (basically a blank canvas) is also available
from the list of HiPS images.
- Add MOC Layer: Adding a MOC Overlay
- It is often useful to see what other data are available. Looking
at a Herschel/PACS far-IR HiPS map? Overlay a Chandra MOC to see what
X-ray data might be available to go with your IR data. Click on the
"HiPS/MOC" menu, and then click "Add MOC Layer." It brings up this pop-up:

Things to note:
- Coverage (the first column) is the fraction of the sky covered by
that MOC.
- To select a new MOC, click on the row corresponding to the new
MOC you want, and click "Add MOC" on the bottom left.
- To cancel without selecting a new image, click "Cancel."
- This is an interactive table, so all the filtering and column manipulation tools apply here
too. You can filter down the columns to find the image you want to
use.
- By default, it shows MOCs likely to be most interesting for IRSA
users. To see a more comprehensive list, unclick the box at the
top left.
- If you have your own MOC FITS file, you may upload it via the
"Use my MOC" tab on the top center.
- If you try to upload a MOC FITS file via the upload tab, it will behave as if you have
uploaded it here.
- Under "HiPS to FITS Conversion", you can control whether the viewer
will automatically toggle between image types as needed.
- By default,
the coverage image is most likely a HiPS image. FITS images are best
for small regions of the sky, and HiPS images are best for large
regions of sky.
- Auto Zoom-in to 2MASS K_s FITS:
- If you select this, then when you
zoom in very close to a target, it will automatically convert to a
FITS image when you get close enough.
- Switch to 2MASS K_s FITS image:
- If you select this, then it will
jump directly to a FITS image centered on the currently selected
target.
Note that if you swap between HiPS and FITS and back again, it
will include a region on the HiPS image that is the footprint of the
FITS images you had just loaded. A label appears at the center of that
footprint, which may be disconcerting if you are not zoomed out enough
to see the region itself. Here is an example, zoomed out so it is
more clear what is going on:

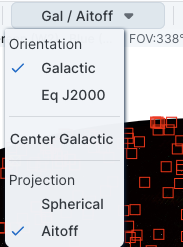
The second drop-down menu looks like this.
|
There are three sections in this menu.
- Orientation
- Under "Orientation", you can control whether the coordinates are
in Galactic, Equatorial J2000 (RA/Dec), or Ecliptic J2000. This
basically is a quick way to orient which way is up on your screen.
Note that this can be
used in conjunction with the image readout
and/or the coordinate overlay layers button.
- Center Galactic
- If you select "Center Galactic", the HiPS image slews (or maybe
twists is a better word) to put Galactic North up, the Galactic Center
in the center of the field of view, and the Galactic Plane
horizontally across your field of view. This is useful if you have
been zooming or scrolling around to look at individual sources and
need to bring it back to a familiar orientation quickly. "Center
Equatorial" does the same thing for the celestial poles, equator, and
ra/dec=0 (those defined by RA/Dec). "Center Ecliptic" does the same
thing, but for the ecliptic plane, poles, and coordinate 0,0. This
feature can be most useful when comparing sky coverage (MOCs) to those
from other missions or surveys that 'work' in alternate coordinate
systems. If you are looking at a coverage map, and you've clicked this
menu choice when you were zoomed in closely on a target that isn't 0,0
in your coordinate system, to "find" your position, click on a row in
whatever table you have loaded on the left to bring your target back
into view.
- Projection
- Under "Projection", you can control whether the display is in
Spherical or Aitoff coordinates. Aitoff projection works better for
all-sky displays.
|