
Contents of page/chapter:
+Introduction
+Image Planes
+Data Tables
+Plots (Charts)
+Choosing among Table, Chart, or Image
+File Contents Menu
+Wavelengths
To visualize spectra, you must be on the search results page, with an instrument tab in the foreground on the left (not the AOR tab) and have the "Data" tab in the foreground on the right. (And, of course, your search must have returned spectra.)
When there are multiple image HDUs or planes (see images section for more on HDUs and planes), you can click on the arrows in the top of the image to scroll through the planes.
If the data are stored as a multi-plane FITS file, you may be able
to scroll through the planes, as in this EXES Level 2 "raw" product:
If the data are stored as a multi-plane FITS file, but where each
plane is a separate, extracted spectrum, it may look like this EXES
Level 3 "spec" product:

If there are additional HDUs, sometimes there is a "File Contents" menu
that appears at the top of the data window, from which you can select
a different HDU image (this is an EXES "readouts_coadded" file):

By default, it shows you all the images in the file and in this case, you can navigate using arrows as in the examples above, but you can also navigate to different HDUs using the "File Contents" menu.
Some FITS files are (nearly unreadable) tables, as in the case of this
FIFI-LS Level 1 product:

Most of the really unreadable ones are lower-level data products.
Many of the higher level tables have useful information but may still
be cryptic, such as this EXES level 3 "sky_orders_merged_1d"
product:
Note that this table has a choice at the top to view it as a table, a spectrum, or an image. In this specific case, the 'table' view is the most human-readable, but see the next section.
Some FITS files can be rendered as plots (sometimes called charts), as
in the case of this EXES Level 3 "mrgordspec" product:

Note that the label of this plot is "extracted data." This means that the data shown here are converted in some way compared to the original data in the FITS file, and if you use the "File Contents" menu at the top left (more on this below), you can access the original data as well as these extracted (or "value added", if you will) data. The tab at the top says "spectrum" as well -- if you want to see the constituent data, you can click on "table" to get it.
Each of these plots can be interacted with as described in the Plots section. The axes labels and units are extracted (interpreted) from the FITS file itself, and may be cryptic, but are meant to give you some indication of the file contents before you download it to work with on your own disk.
 , "Image" is selected; to
pick another option, just click on your choice.
, "Image" is selected; to
pick another option, just click on your choice.
 You can use this menu to select which
part of the data product to view.
You can use this menu to select which
part of the data product to view.
You can have something that is all images, as in this EXES
Level 2 product:

You can have something that is mostly tables, as in this GREAT
Level 4 product:

You can have these options, as for
this EXES Level 3 product:

In this case, you can view the
original data, seen here as "HDU #0 (2D image - show as table or chart
or image)." Or, you can view the "Extracted Data." Note that this
option is indented on the menu. This view of the data is extracted
from the original FITS data, and is sort of a value-added view of
the data that the tool is presenting you, and this view should be the
default for data products with this option. The "Extracted Data" view
will combine information so as to, e.g., plot flux as a function of
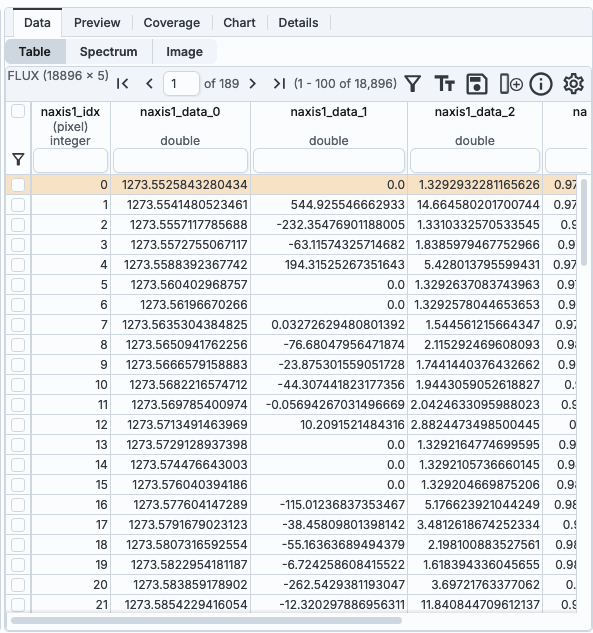
wave number. If you go back to the "HDU #0..." view, and view that as
a table or plot, you will find data with columns like "naxis1_data_0,"
which is what is provided by the data file itself, but the "Extracted
Data" view interprets naxis1_data_0 properly as wavenumber. Here is an
example for this EXES Level 3 product; the first is the "Extracted
Data" table view and the second is the "HDU #0" table view. You can
see how the "Extracted Data" view is easier to scientifically
interpret.


This long example File Contents menu is from a HAWC+ Level 4 product, and
nearly all the image planes are true images.

In this case, the selected option
is "All Images in File," and it becomes a view like the multi-plane
images described above, where you use the arrows to page through
the image planes. However, this menu can also be used to select the
image you would like to view, or view the last three planes (which are
tables).
This example File Contents menu from a FIFI-LS Level 3 product:

shows a mixture of 2D images and tables, including one that contains a
single table cell. This menu also has an "All Images in File," and you
can scroll through all the images. But the data products in this file
are far more diverse than just images, and the File Contents menu is
the most efficient way of exploring these other data planes.
 This FIFI-LS Level 4 product shows
wavelength as one of the planes within the HDU, and you can scroll
through the wavelengths using the second set of blue arrows.
This FIFI-LS Level 4 product shows
wavelength as one of the planes within the HDU, and you can scroll
through the wavelengths using the second set of blue arrows.
 This FIFI-LS Level 3 product shows the
wavelength of the pixel under your cursor when you stop moving your
mouse (look lower center of this screen snapshot). Note
that this only appears when viewing HDUs from the File
Contents menu (as opposed to "all images in file").
This FIFI-LS Level 3 product shows the
wavelength of the pixel under your cursor when you stop moving your
mouse (look lower center of this screen snapshot). Note
that this only appears when viewing HDUs from the File
Contents menu (as opposed to "all images in file").