ISSA Explanatory Supplement
IV. ANALYSIS RESULTS
D. Photometric Consistency
IV. ANALYSIS RESULTS
D. Photometric Consistency
The ISSA images were checked to verify their photometric consistency with other IRAS data products; namely, the IRAS Point Source Catalog and the IRAS Zodiacal History File (ZOHF) (Appendix H). Preparation of the ISSA maps from the IRAS survey scan data was a complex process involving removal of variable zodiacal emission, readjustment of zero points, projection and resampling of the scan data into the ISSA maps and averaging the several survey sky coverages together. Many opportunities to disturb the calibration of the data presented themselves.
Comparison of the IRAS calibration to other measurements is a separate issue and is briefly addressed in §IV.D.3. No adjustments were made to the IRAS photometric calibration based on the results from these comparisons.
D.1 Point Sources
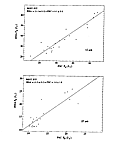
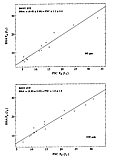
Whereas the ISSA is not designed for efficient analysis of celestial point sources, the filter used to smooth the full resolution IRAS data to effectively 2' samples for the ISSA input data conserves the point source flux to within 10%. Since the basic calibration of the IRAS data is based on point source measurements, testing the fidelity of the reproduction of IRAS Point Source Catalog fluxes in ISSA is an important check on the calibration consistency of ISSA. Point sources for analysis were the same as for position accuracy (§IV.B) and are listed in Table IV.B.1. The integrated flux densities of the selected point sources were measured within circular apertures ranging in size from 2.5' to 9' radius using an annular area from the outer radius of the measuring aperture to a radius of 10' as a background reference. The appropriate AC/DC factor was applied to the extracted point source fluxes (§II.B.2). Plots of the PSC flux vs. the AC-adjusted ISSA flux were made for each aperture size and each wavelength. Fits to the data give the ratio of ISSA flux density to PSC flux density for each aperture size. A plot of the ISSA/PSC flux density ratio vs. aperture size gives the encircled flux density as a function of aperture size for the ISSA data. Assuming a Gaussian shape for the ISSA PSF, the flux density ratio should flatten to a value of 1.00 at an aperture diameter about 3.1 times the FWHM of the ISSA point spread function.|
|
|
Figure IV.D.1 Scatter Plots of PSC vs. ISSA Point
Source Fluxes Measured with a 9' Aperture (continued next page) larger largest |
Figures IV.D.1 and
IV.D.2 display the plots and the encircled
flux density curves for the four ISSA wavelengths. The shape of the
encircled flux density curve is consistent with the measured size of
about 4.5' (FWHM) for the ISSA point spread function.
A circular
Gaussian PSF would have 90% encircled flux density at a radius of 1.1
times its FWHM. The level of the flat
portion of the curve gives the ratio of ISSA to
PSC flux densities as 1.11± .09 at 12 µm, 1.05± .10 at
25 µm, 0.92± .05 at 60 µm and 0.93± .05 at 100 µm.
Two known effects contributing to this difference
are point source tails at 12 and 25 µm, which add about 6%
to the flux within a 7' radius aperture, and noise induced by
the convolution filter, about 4%, which was used to
resample the full resolution IRAS data
to 2' samples (Appendix B).
The 60 and 100 µm ISSA fluxes are less than 1 by about 1.5 sigma.
We know of no reason why they should be less than 1.
|
|
|
Figure IV.D.2 Flux Density vs. Aperture Diameter.
Reference Diameter was 10' larger largest |
|
|
|
Figure IV.D.1 (cont'd) Scatter Plots of PSC
vs. ISSA Point Source Fluxes Measured with a 9' Aperture larger largest |
D.2 Extended Sources
ISSA extended source photometric consistency was checked by comparing ISSA data smoothed to approximately 1° resolution to a version of the IRAS Zodiacal History File (ZOHF) from which the ISSA zodiacal light model (see Appendix G) was removed. The ZOHF is the time-ordered record of the entire IRAS survey in which all the detector signals in each band were averaged to synthesize a 0.5° × 0.5° square beam. The ZOHF includes all calibration and pointing improvements used in producing the ISSA and is the best estimate of the absolute sky surface brightness made by IRAS. ISSA and the ZOHF were derived from the same set of IRAS measurements calibrated and processed in the same way up to the point of averaging the ZOHF to a 0.5° beam and removing the zodiacal emission model from the ISSA data. If the ISSA zodiacal emission model is removed from the ZOHF data and the ISSA data are smoothed to ZOHF resolution the resulting brightness should be the same.
Comparison with the ZOHF reveals the effects of the ISSA
destripers and binner at spatial scales larger than about 1°.
No cross-check of the ISSA data was possible at
spatial scales between 1° and 5'. ISSA and the ZOHF were
compared by preparing all-sky maps with both data sets and
producing scatter plots of a pixel by pixel correlation of the
two maps. The maps used the Aitoff projection in Galactic
coordinates with 0.5°× 0.5° square pixels at the
projection center. The ZOHF has a 0.5°× 0.5°
square beam and required no additional averaging to produce the
map. ISSA data were smoothed to a 0.5° circular beam
before binning into the Aitoff map. Both the ZOHF and ISSA maps
were further smoothed by convolution with a 1.5°×
1.5° rectangle function to reduce differences in the point
spread functions. The comparison was done with the first ISSA
release which covered only the high-ecliptic-latitude,
|| > 50°, sky.
Plots of the ISSA vs. ZOHF were produced for the northern cap of the ISSA map. Trend lines were fit subjectively to the data, with care being taken to assure that the overwhelming number of low surface brightness points would not bias the trend line away from the data at high surface brightness. The slopes of the best-fit trend lines for the data are 0.99± .01, 0.98± .01, 0.97± .02 and 1.00± .02 for the 12, 25, 60 and 100 µm data, respectively.
The slopes from the data indicate that calibration scale factors of ISSA and the ZOHF are the same to within 2% at all IRAS wavelengths. The destriping and binning procedures used in ISSA production had little or no effect on the gain calibration of the data. Examination of the polar mosaics revealed no evidence of field boundary discontinuities larger than 0.1 MJy sr-1, indicating satisfactory performance of the local destriper.
D.3 Absolute Photometry
Checks on the IRAS absolute calibration, which sets the ISSA absolute photometry, generally must be done against other space-based measurements. A few such checks are possible. The Zodiacal Infrared Project (ZIP) (Murdock and Price, 1985) measured the zodiacal light in 15 spectral bands between 2 and 30 µm with a rocket-borne instrument. Comparison of IRAS and ZIP data at 12 and 25 µm showed the same shape for zodiacal emission but the ZIP observations are a factor of about 1.5 dimmer than IRAS. This discrepancy remains unresolved.The Diffuse Infrared Background Experiment (DIRBE) on the Cosmic Background Explorer satellite (COBE) has made absolute surface brightness measurements of the sky in a 0.7° square beam at wavelengths from 1.3 µm to 240 µm (Hauser et al., 1991). Since the IRAS mission was primarily designed to measure point sources and DIRBE was primarily designed for measuring extended emission, we believe the COBE-DIRBE calibration is valid and the DIRBE results provide a check on the large-scale performance of IRAS. The COBE/DIRBE Explanatory Supplement (19 July 1993) presents a preliminary linear transformation between IRAS and DIRBE data, which is shown in Table IV.D.1 below. This linear transformation was derived based on carefully selected DIRBE data compared to IRAS (HCON-1 and HCON-2) scan data. The constants given below are average values for the duration of HCON-1 and HCON-2. The transformations are applicable to spatial scales on the order of an IRAS scan but there is no certainty as to their applicability at smaller spatial scales down to 0.7°. The IRAS point source calibration is not affected by these numbers.
The offset term is relevant to the total intensity IRAS product, the IRAS Zodiacal History File (ZOHF). It is not applicable to the ISSA since the zodiacal emission was subtracted. See Appendix G for details on the zodiacal model. The offset term is known to have a systematic variation with time at 12 and 25 µm. The offsets given below are simply mean values and do not reflect this trend. The user should refer to the COBE-DIRBE Explanatory Supplement to better understand the offsets at 12 and 25 µm.
The gain term is applicable to both the ISSA and the ZOHF
and shows the IRAS measurements at
60 and 100 µm were too bright relative to DIRBE at
large spatial scales.
There is no simple prescription for unraveling the varying
spatial response of the detectors to effect a more accurate
calibration for the ISSA images. The data given in
Table IV.D.1 are representative of the comparison of IRAS
HCON-1 and HCON-2 scans with DIRBE data based on the
current DIRBE calibration.
The gains at 12 and 25 µm are consistent with IRAS.
The IRAS brightness appears to be 13% and 28% high at
60 µm and 100 µm, respectively. The 60/100 µm
color is about 12% too low in IRAS data relative to
DIRBE data.
| I(DIRBE) = Gain × I(IRAS) + Offset | Fractional Effect* | ||
|---|---|---|---|
| Wavelength (µm) | Gain | Offset (MJy sr-1) | |
| 12 | 1.06±0.02 | -0.48±0.43 | -.04±.03 |
| 25 | 1.01±0.02 | -1.32±0.74 | -.06±.03 |
| 60 | 0.87±0.05 | +0.13±0.65 | +.02±.08 |
| 100 | 0.72±0.07 | -1.47±0.88 | -.15±.09 |


