I. Introduction
6. Cautionary Notes
a. General
i. Preliminary Nature of the Incremental Release Products
The 2MASS Incremental Data Releases are the result of the first
processing of data from the Survey performed while Survey observations
are ongoing. Rigorous quality assurance procedures used during
Survey data processing indicate that the vast bulk of the released
2MASS data products meet or exceed the high scientific standards of the
Survey. However, validation of a dataset
as large as that being produced by 2MASS presents a great challenge,
and it is expected that there will be problems both known and unforeseen that
persist into the release data products. These data do not yet benefit from
all experiences that will be gained over the full Survey, in particular
the analyses of the full-sky dataset, nor have they
undergone all the rigorous analyses that accompany data
releases at the end of mission. However, the benefits of releasing data to
the community now exceed potential risks, and
the feedback from the community on the data products and documentation
will ultimately contribute to a better final product. The knowledge
gained as the survey continues, and from the feedback received
from users will be incorporated when the entire 2MASS dataset is reprocessed
at the completion of the Survey observations.
NB: Users are strongly recommended to review the caveats listed below.
ii. Sky Coverage and the Survey Tiles
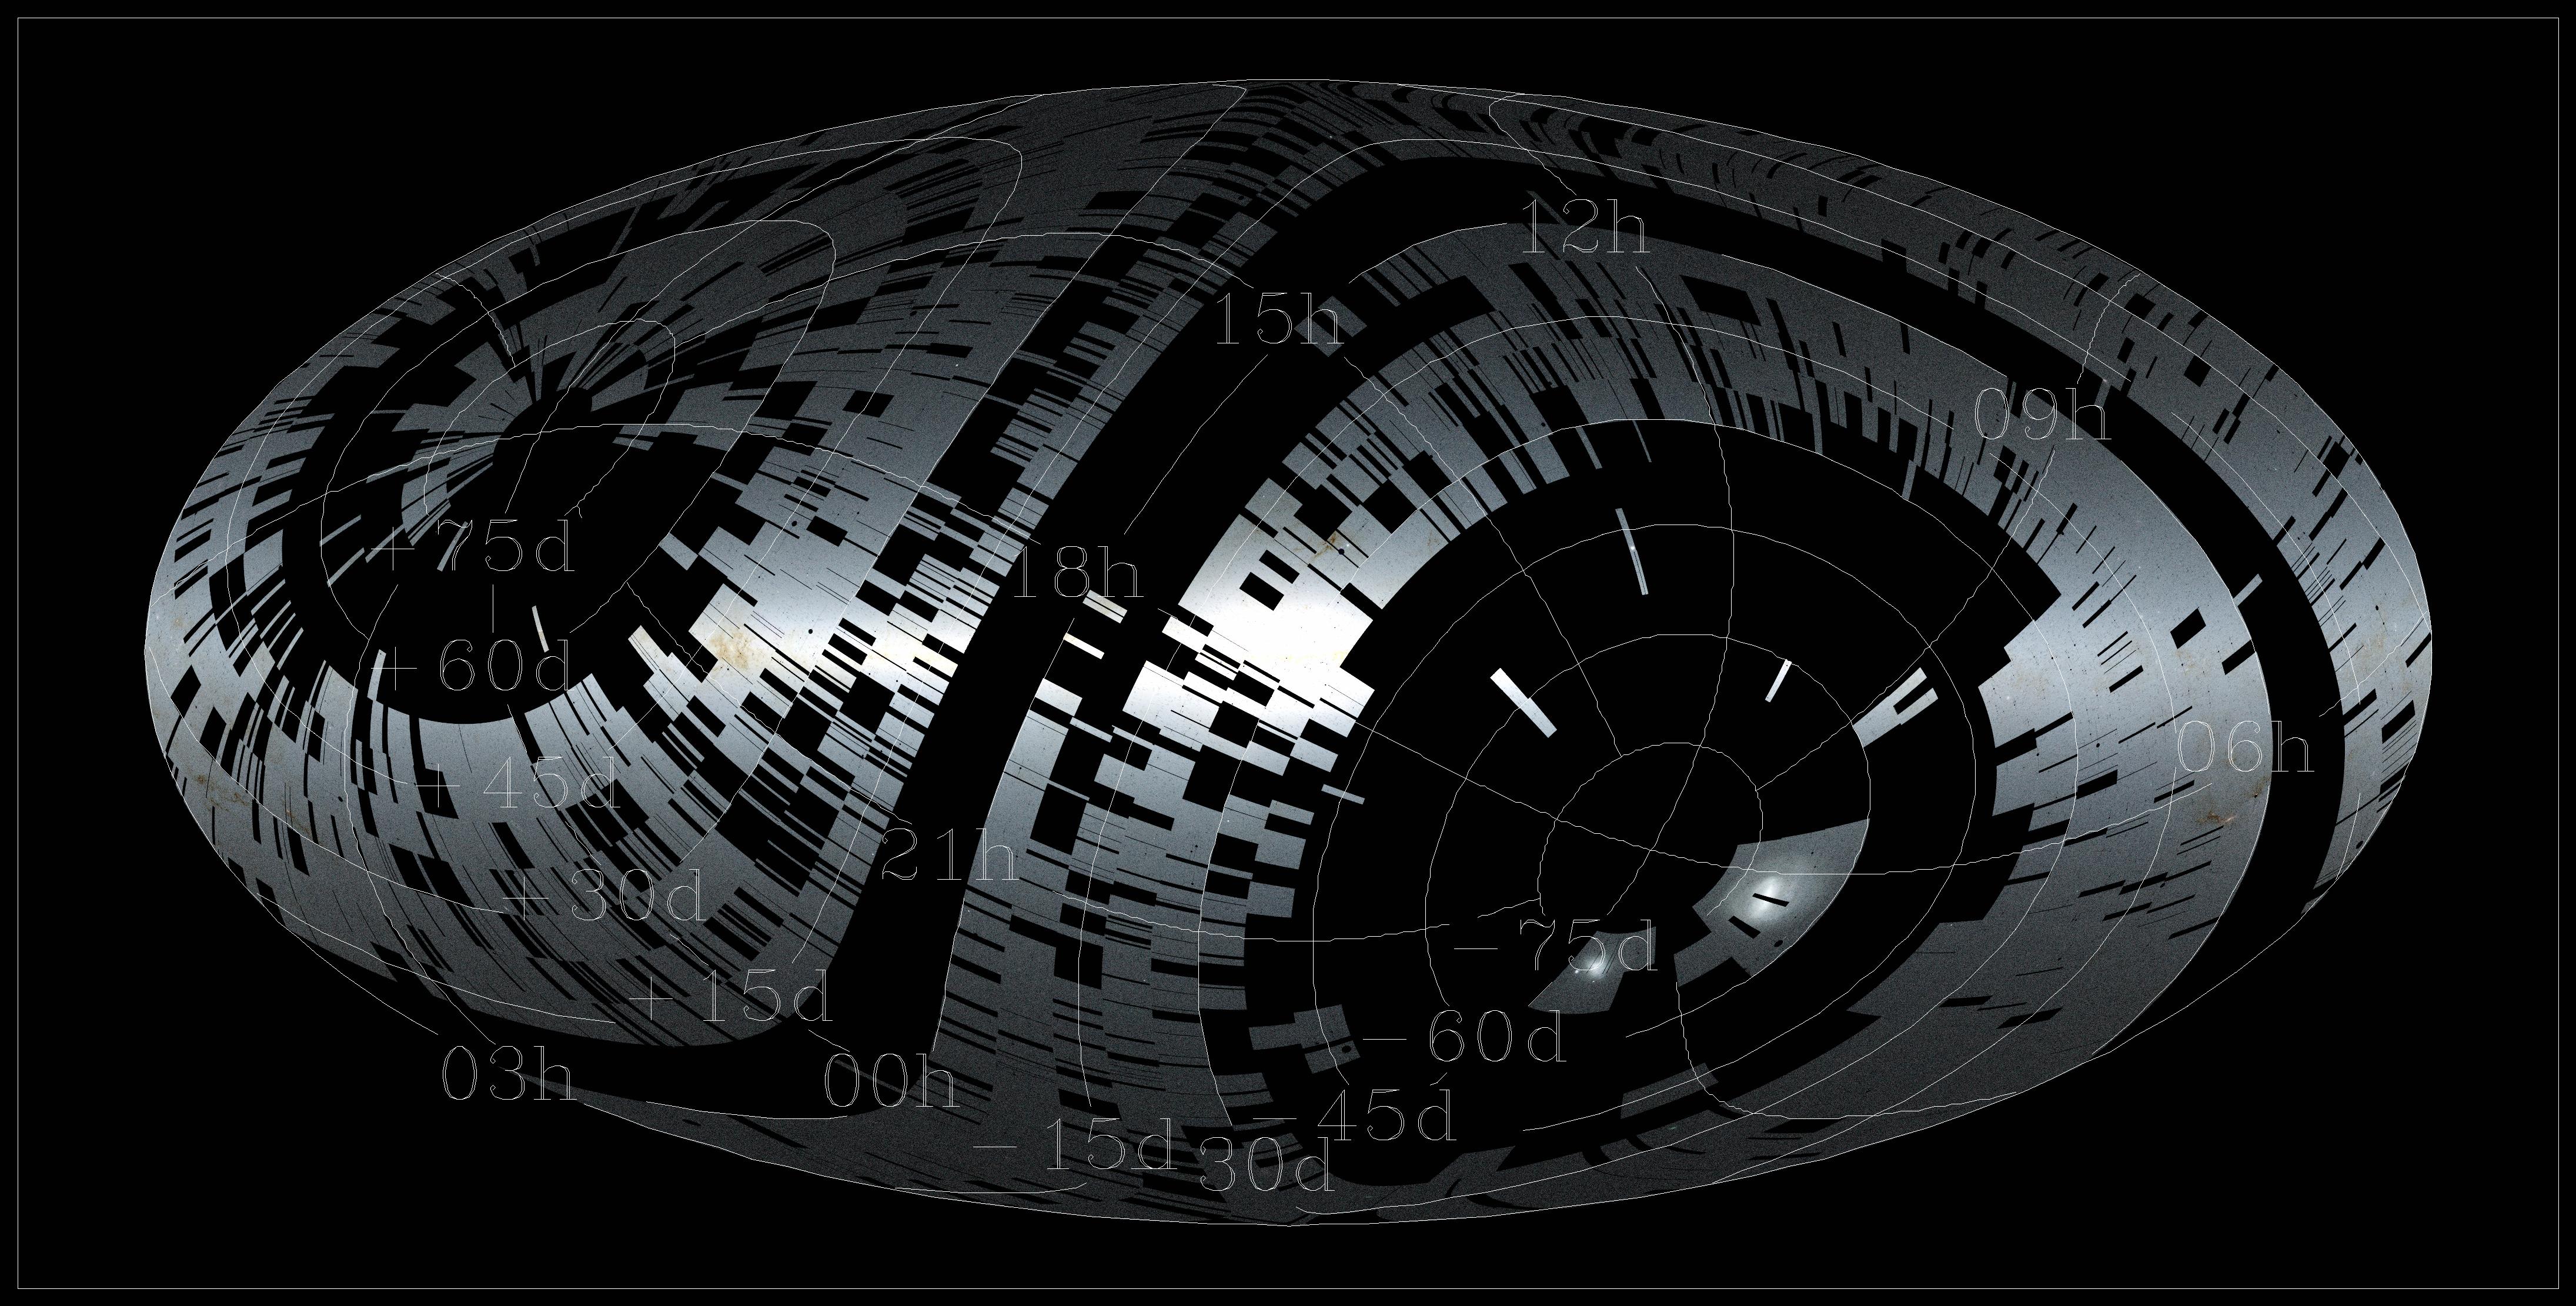
Figure 1, a composite map of the
J, H and Ks surface density of objects in the
2MASS Second Incremental Release Point Source Catalog, illustrates that
there are many gaps in the sky coverage for this release.
The uneven sky coverage results from the spatial and scheduling strategy
used to carry out the Survey.
The absence of an object of interest from the
Incremental Release Catalogs does not necessarily mean that the object
was not detected in the Survey, but rather it may be in a region not included
in this Release.
The 2MASS telescopes scan the sky in units of Survey
Tiles which are one camera frame
(8.5´) wide in the Right Ascension direction and 6° long in
declination.
On average, each telescope scans approximately 60 tiles each clear night.
Because the RA coverage rate is slower than the sidereal rate,
several contiguous, but not necessarily adjacent, blocks of Tiles are
observed each night. Therefore, adjacent Tiles may be observed
at very different times during the Survey.
In addition, non-photometric or other sky conditions can force
the rejection of the observations of some of each night's Tiles.
Those Tiles are reobserved at a later date
which further adds to the time discontinuity in
sky coverage.
The regions included in the Incremental Releases can be examined
using the Survey
Visualizer, or queried with the
Coordinate Search Tool.
The Scan Information Table
that is accessible via IRSA, ftp, or DVD-ROM,
provides the observation date, reconstructed position (J2000 RA and DEC of the
four scan corners) and various observational and calibration
characteristics for each Tile contained in the Release.
The effective sky coverage of 2MASS is also diminished because
areas around bright stars are masked to remove the large number
of spurious detections that are trigerred by diffraction spikes,
dichroic glints and latent images. In addition, several larger
regions have been masked out the Extended Source Catalog. These
areas include the
Galactic Center, where the source
densities are so high that virtually all XSC sources are multiple
stars and not truly extended, and segments of a few tiles in which
the
atmospheric seeing was not tracked properly, leading to
inaccurate extended classification for sources.
 |
| Figure 1 |
iii. Catalog Reliability
In unconfused regions, the target reliability for sources in the 2MASS
Catalogs is 99.95% (PSC) and 99% (|b|>20o and 80%
(10o < |b| < 20o) for the XSC.
Analyses of the Incremental Release Catalogs
indicate that a relatively small fraction of sources that
technically meet the Catalog
source selection criteria
are known to have photometry and/or classification corrupted
by nearby sources, or are
outright spurious detections of image artifacts.
Extensive efforts have been made to identify and flag such objects that
remain in the Catalogs.
The PSC and XSC source records
include a contamination and confusion flag
(cc_flg) that identifies sources that should be considered with
extreme caution.
User's who wish to draw samples of sources from the PSC or XSC
that maximize reliability and photometric accuracy should select sources that
have cc_flg="000" in the case of the PSC, and cc_flg="0"
for the XSC.
iv. Photometric System
Magnitudes reported in the Point and Extended Source Catalogs are
in the natural 2MASS photometric systems.
Sections III.2.c and
IV.8 describe
the Survey calibration procedure. Transformation equations to other photometric
systems are not yet available. However, 2MASS colors for
normal stars lie very close to those reported by
Koorneef
(1983, As.Ap. 129, 84) and
Bessell and Brett (1988, PASP, 100, 1134).
v. Global Photometric Accuracy
The global photometric uniformity of the 2MASS Catalogs is
enforced by nightly photometric calibration to an extensive set of
standard star fields. However, it will be difficult to assess the
overall photometric uniformity of the survey until most of the sky has
been analyzed. Analysis of the internal consistency of large numbers of
stars in multiply-observed calibration fields indicates that the systemmatic
variations of the 2MASS flux calibration
frame of reference are of order 1% around the sky.
vi. Tile Overlap Regions
Successive 2MASS Survey Tiles
overlap each other by approximately one arcminute in the Right Ascension
direction and 8.5´ in Declination. Therefore, approximately
15-20% of sources in the Survey can be detected multiple times.
To avoid artificial sensitivity biases in the Tile overlap
regions, the Point and Extended Source Catalogs contain data from
only a single measurement for multiply detected sources, and not
averaged data.
The measurement that is included in the Catalogs is from
the apparition that falls farthest from the edge of its
respective Survey Tile (or equivalently closest to its Tile center).
Very faint sources in Tile overlap regions may not be detected in all
scans of those regions. Such a faint detection is selected for inclusion
in the Catalog only if it falls farther from the edge of its Tile than
its virtual counterparts
in overlapping Tiles fall from the edges of their Tiles.
Section V.3 provides a more detailed explanation of
the duplicate source rectification procedure.
The duplicate source selection procedure operates only on the edges of
Tiles that have an overlapping Tile that is also in the Second Incremental
Data Release. For Tiles in the Release with "unbounded" edges,
all qualifying sources out to within 10" (PSC) or 15" (XSC) of
the unbounded edges are included in this Incremental Release.
In subsequent Incremental Release Catalogs, these apparitions may be replaced by
the appropriate source in an available overlapping Tile, or
in the case of very faint sources, the source may not appear at all.
The 2MASS Atlas Images are derived directly from the
2MASS tile observations. The sky region in
the westernmost 10% of an Atlas Image may
appear on the eastern edge of the adjacent Image.
The 2MASS Survey Visualizer is designed to return the Atlas
Image for which the input coordinate is closest to the
tile center. If the input coordinates for an object
of interest are not accurate (as sometimes occurs for
name-resolved positions), the target may lie on
extreme edge of the Atlas Image. In these cases, it is possible that
a query aimed at returning the adjacent Atlas Image may
yield a more centered image of the source. During
the Incremental release period, however, the adjacent
Atlas Images may not be available.
vii. Artifacts
Meteors and artificial satellites produce trails that frequently appear
on 2MASS raw data frames.
Since the camera observes each position on the sky
in six consecutive frames, the coaddition of
frames mitigates the contamination from the trails. However,
meteor and satellite trails persist into the Atlas Images, where they
often trigger
point and/or extended source detections. These "sources"
are usually characterized by high
The rigorous quality assurance procedures applied
to all 2MASS data products have largely identified
rogue artifacts such as airplanes, insects walking
across the camera window, and rare failures of
the camera readout electronics, and identified those
survey tiles for re-observation -- thus excluding
them from the release data. Inspection of a fraction
of the Images in the release suggests a few such artifacts
may remain. Again, users are encouraged to review the images
of sources of interest.
The 2MASS Catalog products are static. No deletions
will be made after a particular release, even for sources that
are known to be artifacts, until the Catalog is rereleased
after reprocessing. Separate anomaly lists will be provided
that are updated at regular intervals.
[Last Update: 2000 January 26; R. Cutri, M.Skrutskie, T.Chester]
Duplicate Source Rectification
Consequences for Atlas Images
Meteors and Artificial Satellites
 2
values and low "N/M" statistics in the case of point sources
(see IV.4c). Many of these
false detections have been removed from the Catalogs,
but the algorithm to identify trails is not 100% efficient.
Users are encouraged to review the images of interesting sources to rule out
the possibility that they may be meteor or satellite trail detections.
2
values and low "N/M" statistics in the case of point sources
(see IV.4c). Many of these
false detections have been removed from the Catalogs,
but the algorithm to identify trails is not 100% efficient.
Users are encouraged to review the images of interesting sources to rule out
the possibility that they may be meteor or satellite trail detections.
Insects, Electronics Glitches, etc.
Anomaly Lists
Previous page. Next page.
Return to Explanatory Supplement TOC Page.