V. Catalog Generation
4. Tile Edges and Overlap Resolution
Point sources are required to be >10´´ from Tile edges, and
extended sources must be >15´´ from Tile edges to be candidates for
passing from the Working Point and Extended Source Databases to
the respective Catalogs. For this purpose, a Tile Edge is defined
to fall along the great circles interpolated between the four
Tile corners that are listed for each Tile in the Release
in the Scan Information Table.
These safety boundaries serve three purposes:
a. Tile Edges
|
 |
| Figure 1 | Figure 2 |
b. Overlap Resolution
Adjacent Survey Tiles overlap by a minimum of 52´´ in right ascension and approximately 8.5´ in declination (cf. III.2.a). Sources that fall in the overlap regions between Tiles may be detected two or more (in the corner regions and near the poles) times during the Survey. Thus, the Working Databases can contain multiple apparitions of such sources. The Point and Extended Source Tables in the 2MASS Sampler data release (1998 December) intentionally included all detections of sources in the overlaps regions to provide users an idea of the duplication of sources between Tiles.
The 2MASS Incremental Data Release Catalogs are intended to contain a unique entry for each source on the sky. Because the Catalogs are also to have a high degree of photometric uniformity, it is necessary to select only one apparition of a multiply-detected source in the Tile overlaps regions rather than averaging the properties from multiple detections. To avoid introducing subtle sensitivity biases, a simple geometric algorithm is used to select which apparition of a source is selected as a candidate for the Catalogs. Special care is made in handling faint sources near the detection limit of the survey that may not be detected, or in the case of extended sources, resolved in all scans that cover their position.
For all sources that fall in the nominal Tile overlap regions, less the safety borders described above, all possible apparitions are found by positionally matching sources in adjacent scans using a search radius of 2´´ for point sources, and 5´´ for extended sources. A particular apparition of a source is a candidate for inclusion in the Catalog using the following criteria:
- The horizontal (EW) and vertical (NS) distances from the two nearest Tile edges, dh and dv, respectively, are evaluated for all apparitions of the source.
- If the source is not detected in all observed Tiles that cover its position, then a "virtual" duplicate of the source is created in the Tiles in which it was not detected. Consider only virtual duplicates that fall more than the safety border distance from the edges of their respective Tiles.
- Determine the minimum of dh or dv for each apparition, real and virtual, in their respective Tiles.
- Select the apparition that has the larger min(dh,dv). If a real apparition is selected, then it is included in the Catalog. If a virtual apparition is selected, then no source is included in the Catalog. Note that this forms a somewhat complex boundary between Tiles in the very corners (see below).
Note that if a source in the overlap region is not detected in all possible coverages, it will be passed into the final Catalog only if it is on the proper side of a geometrical boundary. This normally affects faint sources near the detection limits of the Catalogs, but may also affect brighter sources that either move between the time adjacent Tiles are observed (e.g., asteroids or high proper motion stars), or variable brightness sources. The handling of sources not detected in all coverages for this Release is different than in the Catalog Generation for the 2MASS First Incremental Data Release. In the First Incremental Data Release, a non-multiply-detected overlap source would always be a candidate for the Catalog, regardless of its position. Thus, the First Incremental Data Release Catalogs had a slight sensitivity enhancement in the Tile overlap areas.
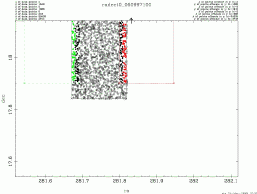
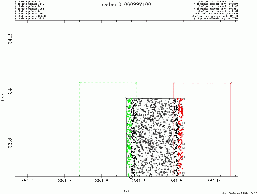
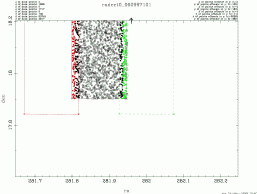
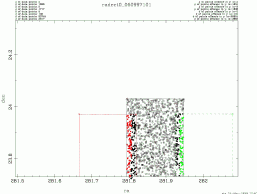
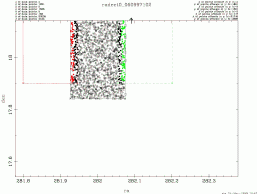
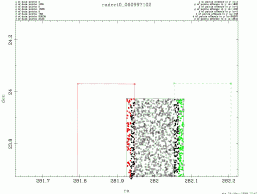
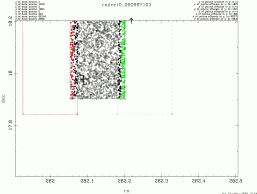
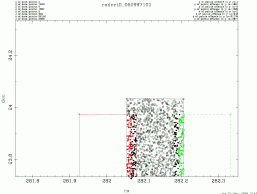
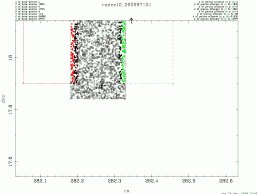
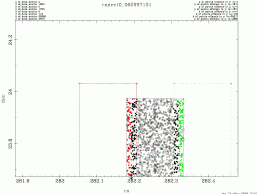
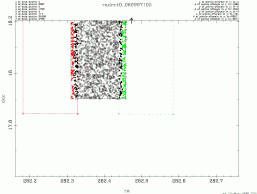
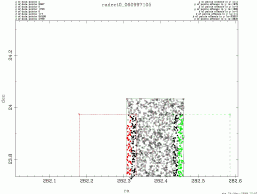
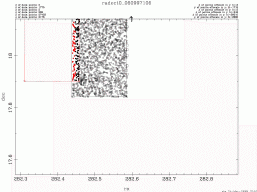
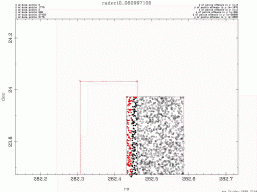
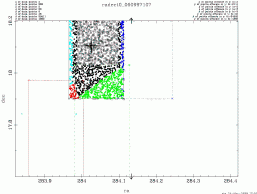
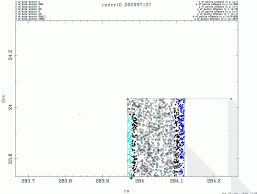
i. Graphical Examples of Overlap Source Resolution
Figures 3-18 below show graphically the result of the resolution of point sources in Tile overlap regions for a set of eight Tiles in the Second Incremental Data Release. Each figure shows sources centered on one Tile (specified by the observation date, hemisphere and nightly scan number) that are drawn from either that Tile (outlined in black), or the adjacent Tiles (outlined in other colors). Open circles are sources from the central tile not in overlap regions. Filled circles are sources in the overlaps. The color of the filled circle indicates from which Tile the apparition marked for inclusion in the Catalog is selected. Thus, in the first example from scan 100, the red circles on the eastern edge come from the Tile to the west, and the green circles come from the Tile to the east. The black circles are drawn from the central tile. Open squares show objects that fall in the outside safety boundary edge of the central Tile.
Most of the examples show the relatively simple two-scan interface. The example for scan 107 south, illustrates the behavior of the resolution algorithm in the complex boundaries between three Tiles. The algorithm is generalizable to large numbers of overlaps, such as will occur near the equatorial poles.
|
|
|
 |
| Figure 3 | Figure 4 | Figure 5 | Figure 6 |
| 970609n Scan 100 south | 970609n Scan 100 north | 970609n Scan 101 south | 970609n Scan 101 north |
|
|
|
 |
| Figure 7 | Figure 8 | Figure 9 | Figure 10 |
| 970609n Scan 102 south | 970609n Scan 102 north | 970609n Scan 103 south | 970609n Scan 103 north |
|
|
|
 |
| Figure 11 | Figure 12 | Figure 13 | Figure 14 |
| 970609n Scan 104 south | 970609n Scan 104 north | 970609n Scan 105 south | 970609n Scan 105 north |
|
|
|
 |
| Figure 15 | Figure 16 | Figure 17 | Figure 18 |
| 970609n Scan 106 south | 970609n Scan 106 north | 970609n Scan 107 south | 970609n Scan 107 north |
c. Unbounded Tile Edges
The overlap source resolution described above requires knowledge of the actual position of adjacent Tiles. If a Tile in the Second IDR has edges unbounded by other Tiles, then all sources out to the safety boundary on the unbounded edges will be candidates for passing into the Catalogs. In future Releases, the adjacent Tiles will be included, and the resolution of sources in the overlaps will be revised.
[Last Update: 11 February 2000, by R. Cutri, S. Wheelock and H. McCallon]
Previous page. Next page.
Return to Explanatory Supplement TOC Page.