I. The Scan Noise
The Scan Noise was defined to provide an estimate of the characteristic point source photometric measurement uncertainty over a 2MASS scan by minimizing the impact of confusing and other local effects that might elevate the uncertainty for individual sources. The original definition and analysis of the Scan Noise is given here. As discussed in the original analysis, the Scan Noise reacts not only to confusion, but also to scan background and seeing levels in a way consistent with repeatability statistics, as expressed in the Photometric Sensitivity Parameter (PSP).
In short, the Scan Noise is estimated from the mode of the distribution of the noise values for all non-saturated R2-R1 sources in a scan deduced from the PROPHOT measurement uncertainties. For each source not identified with an artifact, the noise is evaluated from the magnitude and magnitude sigma, converting to milli-Janskeys using the flux-for-zero magnitude values of 1603e3, 1075e3 and 698e3 mJy for J, H and Ks, respectively. The mode of the noise distribution is taken to be the first maximum in the histogram of the logarithm of noise values over bins of 0.015 log mJy. In the event that more than one bin in the histogram has the same maximum, the bin having lower noise is used. The logarithm of the J, H and Ks Scan Noise values (in mJy) are carried in the Scan Info tables in the Working Database. They are the j_pts_noise, h_pts_noise and k_pts_noise fields.
Because the Scan Noise is derived from the peak of the distribution of noise values from all sources, it will be dominated by the effect of fainter (i.e. lower SNR) sources since they are the most numerous. If there is a brightness-dependent systemmatic bias in the measurement noise, then the the scan noise may not be representative of the noise associated with measurements of brighter sources.
II. The Scan Signal-to-Noise Ratio
The Scan Signal-to-Noise ratio (Scan SNR) is evaluated for each detected band by forming the ratio of the source flux (using the same flux-for-zero-magnitude values given above) to the scan noise in the appropriate band. Scan SNR is carried along in the point source record in the Working Database in the ?_snr fields.
The Scan SNR values were originally devised to provide a means for making sure that a relatively bright source that had high uncertainties due to local effects such as confusion could still be passed into the catalog if SNR thresholds were used. This is even more important in final processing because saturated R1 stars are assigned large uncertainties.
III. Relationship Between Scan SNR and Photometric Uncertainties
Laurent Cambresy's web page showing SNR and sigma distributions
Focus on low SNR regime
IV. Assorted Scan Noise Plots
The following figures show the relationship between the derived scan noise and source density and galactic coordinates for the ~21,700 survey scans in the working database as of 6 November 2001.
- Figures 1a-c show the J, H and Ks scan noise, respectively,
plotted versus the number of
detections in each band for all survey scans. The small black points
represent individual scans while the large red points show the
2-sigma trimmed average noise in 0.05 log counts bins. The error
bars are the formal RMS of the trimmed average in each bin.
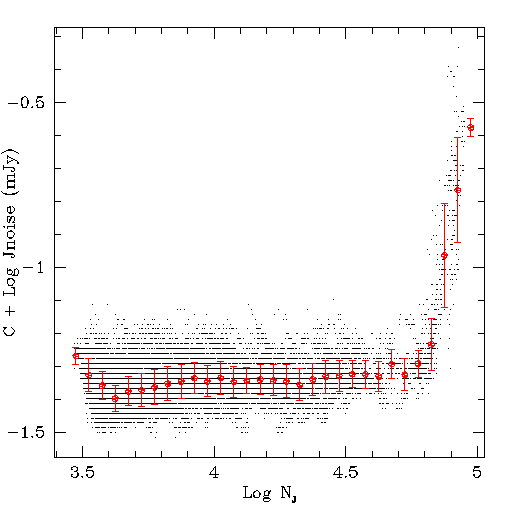
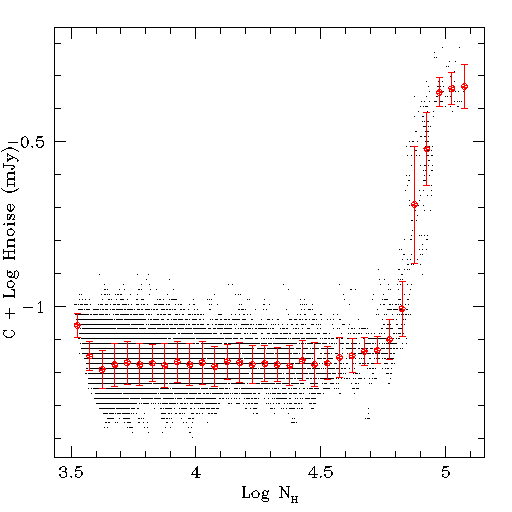
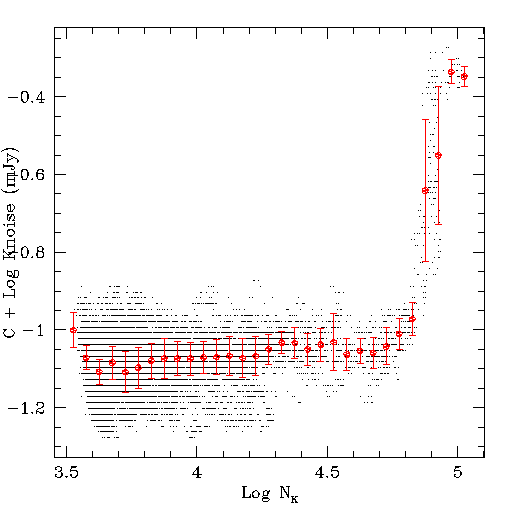
Figure 1a Figure 1b Figure 1c These plots illustrate how the scan noise tracks primarily the effects of confusion on the point source photometry. The noise range remains relatively constant until source density of ~50,000 detections per scan (~59,000 deg-2).
- Figure 2 shows the histograms of J, H and Ks scan noise
values for all scans with <31,000 detections in the respective bands.
J, H and Ks are shown in the top, middle and bottom panels,
respectively. At low source density, the scan noise can still
vary by a factor of ~1.5 because of the dependence of
photometric measurement uncertainty on sky conditions and PSF-fitting
systemmatics. Therefore, sources with the same brightness
can have Scan SNR values that vary by factors of 1.5 from scan-to-scan.
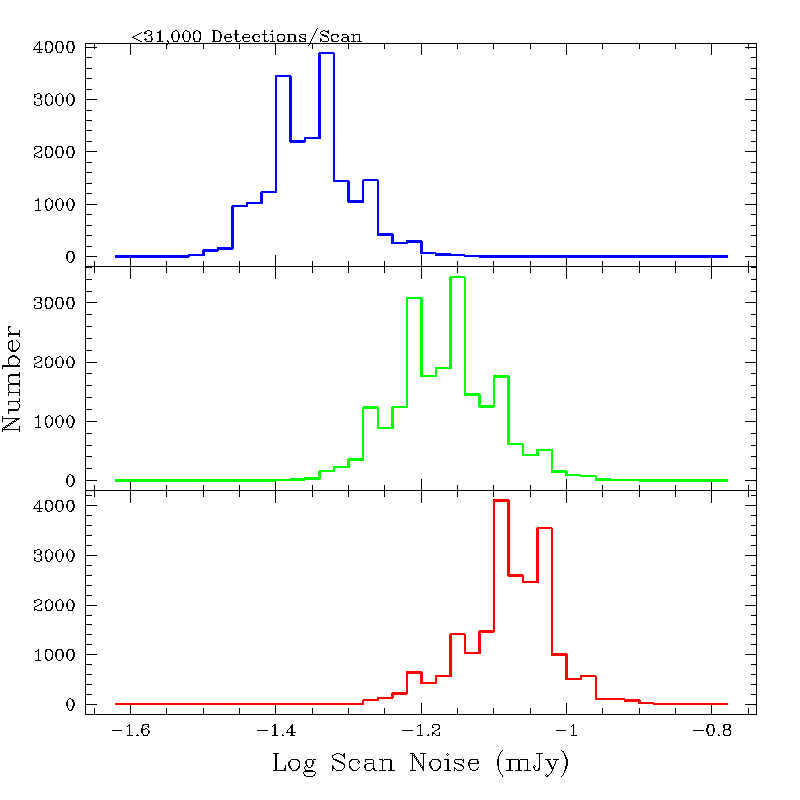
Figure 2 - Since the scan noise reacts strongly to confusion noise
above a minimum source density, there will be a strong dependence
on galactic position in the scan noise. Figure 3 shows
the Ks scan noise plotted as a function of galactic
latitude for all scans. The red points indicate scans
that are within 30o of the galactic longitidue
of 0o.
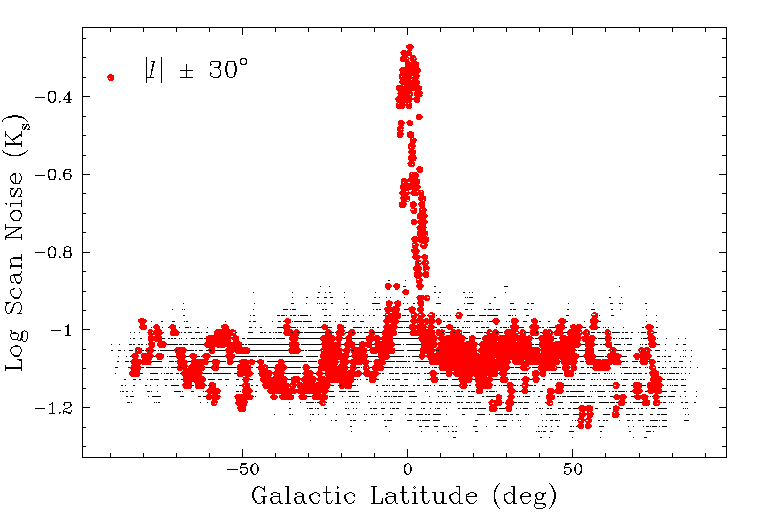
Figure 3
V. Relating Scan Noise to Noise Derived from Repeatability Statistics
1. Direct comparison of repeatability statistics and PROPHOT quoted uncertainties
Since the scan noise is derived from the photometric measurement uncertainties, it is useful to investigate how those uncertainties are related to another measure of photometric accuracy, namely the repeatability statistics derived from repeated measurements of calibration scans. A direct comparison can be made between the two can be made using the merged cal set output generated for each night's processing. This output is used as part of calibration QA, and is the result of positionally correlating each of the six calibration scans in each set. Files are generated that contains the mean position and brightness of each unique source, along with the RMS position and brightness residuals, as well as the mean measurement error (sigma). These files are used to generate the familiar RMS vs. magnitude plots, such as the one shown in Figure 4.
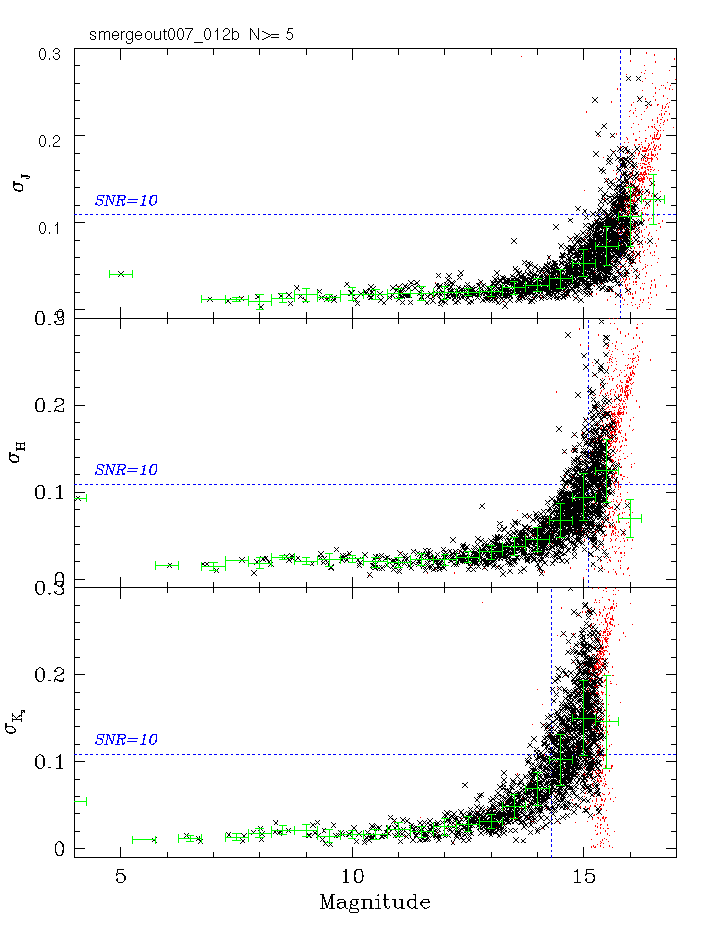 |
| Figure 4 |
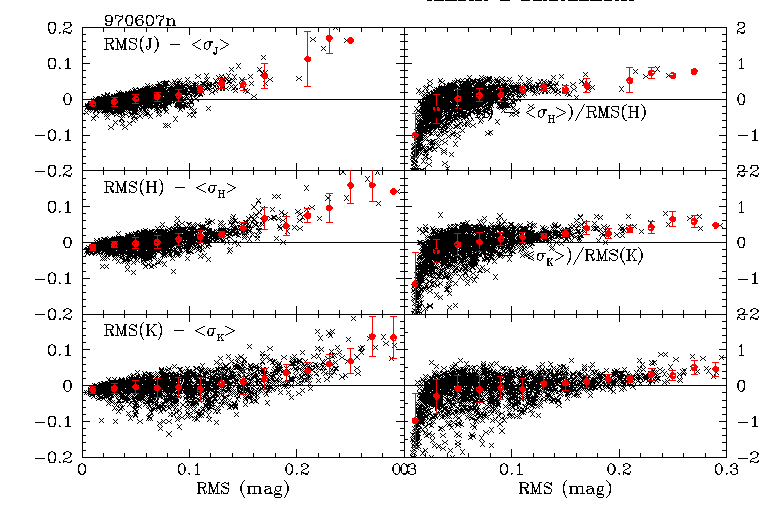
Figures 5a and 5b show for one northern and southern night, respectively, the difference between the RMS brightness (vertical axis in Figure 4) and mean photometric error plotted as a function of RMS (all in magnitudes) in the left column, and the mean difference divided by RMS in the right column. The difference distributions for J, H and Ks are shown in the top, middle and bottom rows, respectively. The black crosses are the data for individual objects detected six out of six times in each cal set for the night. The red points are the trimmed-average difference in bins 0.02 mags wide, and the error bars on the red points are the RMS residuals (i.e. population sigmas) of the trimmed averages in each bin. An script error resulted in incorrect labels on the right columns of the northern figure. Please see the southern figure for the correct labelling.
 |
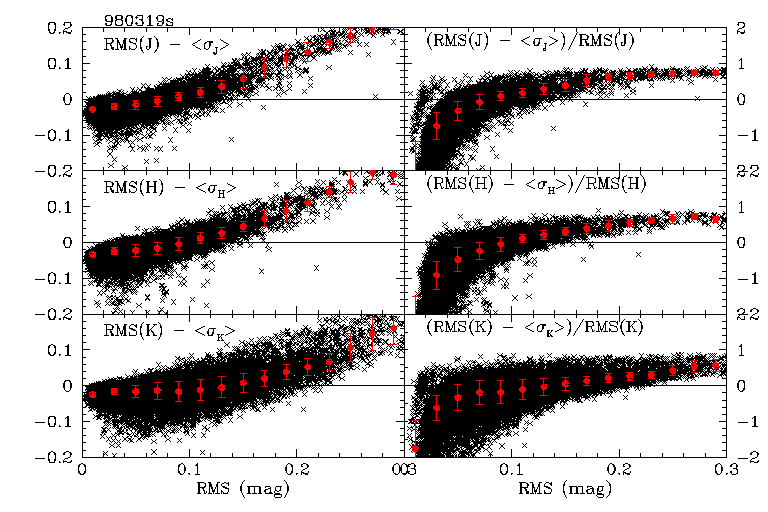 |
| Figure 5a | Figure 5b |
Although there is considerable scatter in the differences on any given night, the average difference distributions are remarkably consistent for RMS values <0.2 mags over the survey. Figures 6a and 6b are whirlgifs that cycle through difference distributions for several hundred northern and southern nights, respectively.
 |
 |
| Figure 6a | Figure 6b |
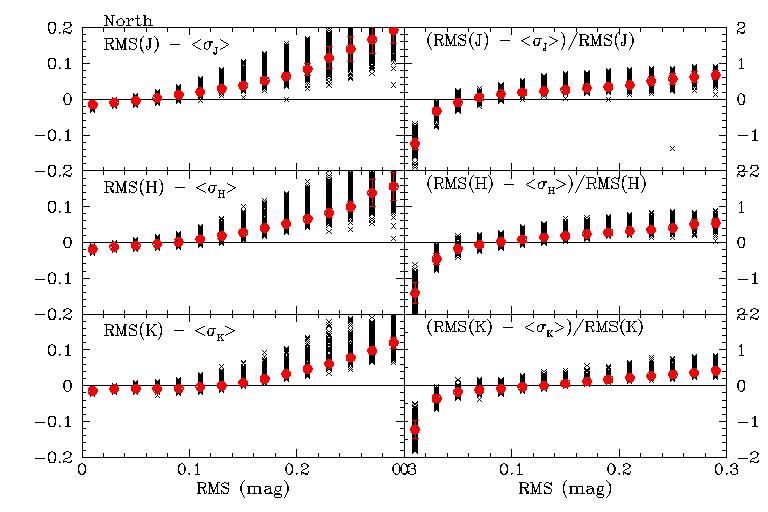
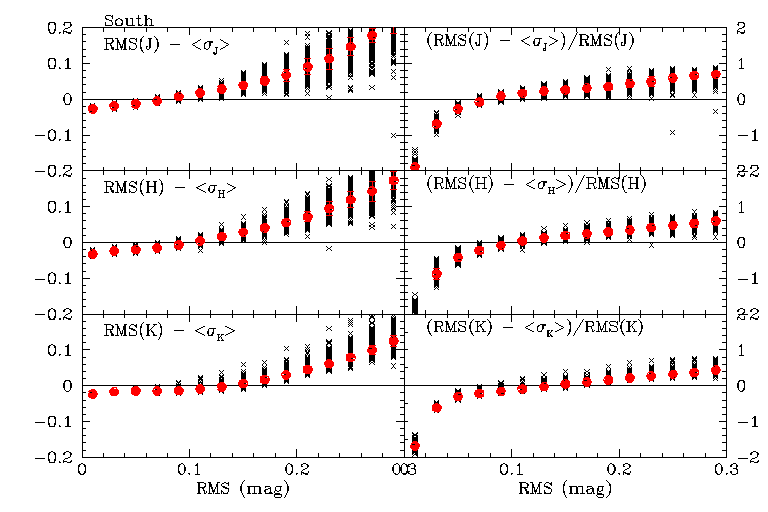
Figures 7a and 7b shows for the north and south, respectively, the average of all of the binned-trimmed-average differences for the 300 northern and 360 southern nights contained in Figures 5a and 5b. The black crosses are the binned-averages from each night, and the red points are the RMS of the binned averages. The vertical disrtibutions of the black crosses are somewhat misleading since there is no feeling of the density of points.
 |
 |
| Figure 7a | Figure 7b |
For small RMS sources, the quoted photometric uncertainties are larger than the repeatability statistics. As RMS increases, the measurement sigmas become systemmatically smaller relative to the RMS. The cross-over points, where the repeatability RMS and photometric sigmas are on-average equivalent, are at RMS values of 0.07, 0.09 and 0.13 mags (J, H, Ks) in the north, and 0.08, 0.11 and 0.13 mags in the south.
2. Scan-Averaged Values
Scan noise and Repeatability "noise" can be related through the Photometric Sensitivity Parameter (PSP = SH*BG0.29 ). The PSP is an empirically derived measure of how photometric repeatability varies with the mean seeing shape (SH) and the mean frame background (BG) in a scan.
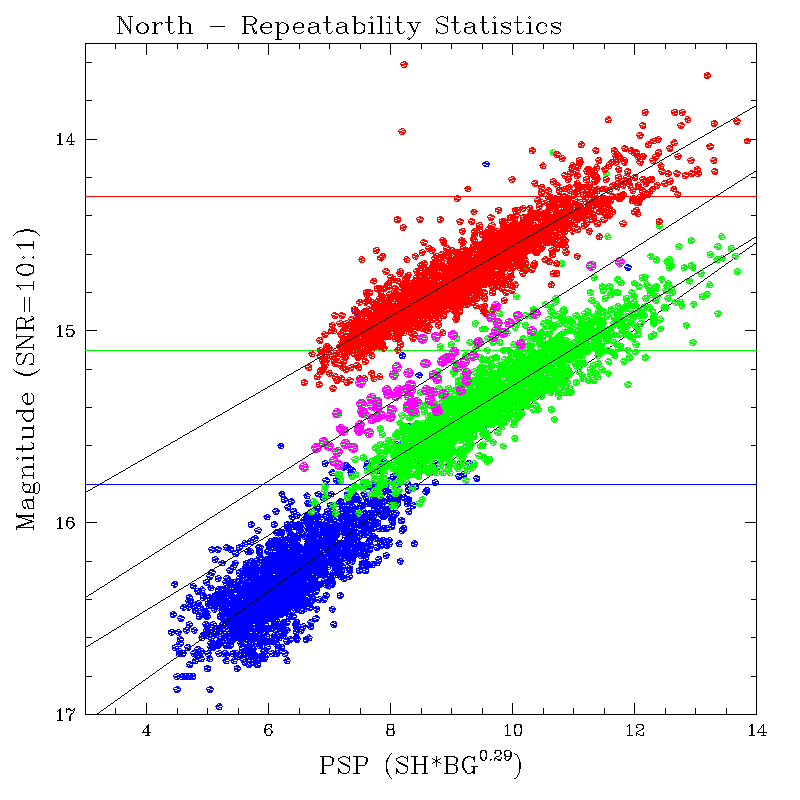
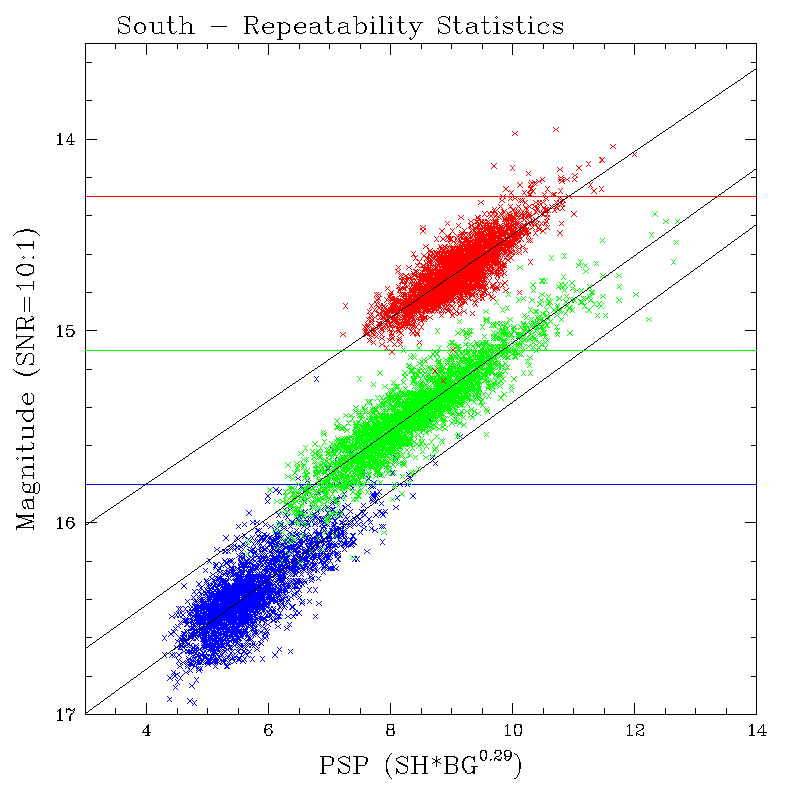
Specifically, analysis of photometric repeatability in calibration scan sets shows that the magnitude at which the RMS dispersion equals 0.10857 mags (M10:1 - the repeatability SNR=10:1 level) varies linearly with PSP. The repeatability statistics derived from calibration sets measure the random component of the photometric measurement error, so PSP can be used as a proxy for the random measurement error average over a scan, but at a specific RMS level.
a. Repeatability Statistics and PSP
Figures 8a and 8b show the relationship between M10:1 and PSP derived from all final-processed calibration scan sets available as of 15 November 2001. Blue and red points in the plots denote J, and Ks, respectively. For the northern H-band plot, the green crosses are data from the old H-band array (<990904n) and the magenta circles are data from the new H-band array (>990904n). The horizontal lines in the plots show the magnitudes at which the Level 1 Requirements specify SNR must exceed 10:1.
The best linear fits (M10:1 = C*PSP + D) to the data are indicated on the plots and the coefficients for the fits are summarized in Table 1.
 |
 |
| Figure 8a | Figure 8b |
Table 1 - M10:1 vs. PSP Linear Fit Coefficients
| North | South | |||
| Band | C | D | C | D |
| J | -2.275611e-01 | 1.772250e+01 | -2.315502e-01 | 1.768879e+01 |
| H-all | -1.848940e-01 | 1.712727e+01 | -2.276649e-01 | 1.734118e+01 |
| H-old_array | -1.948035e-01 | 1.723503e+01 | ||
| H-new_array | -2.020431e-01 | 1.699436e+01 | ||
| Ks | -1.833622e-01 | 1.639298e+01 | -2.166316e-01 | 1.666313e+01 |
b. Scan Noise and PSP
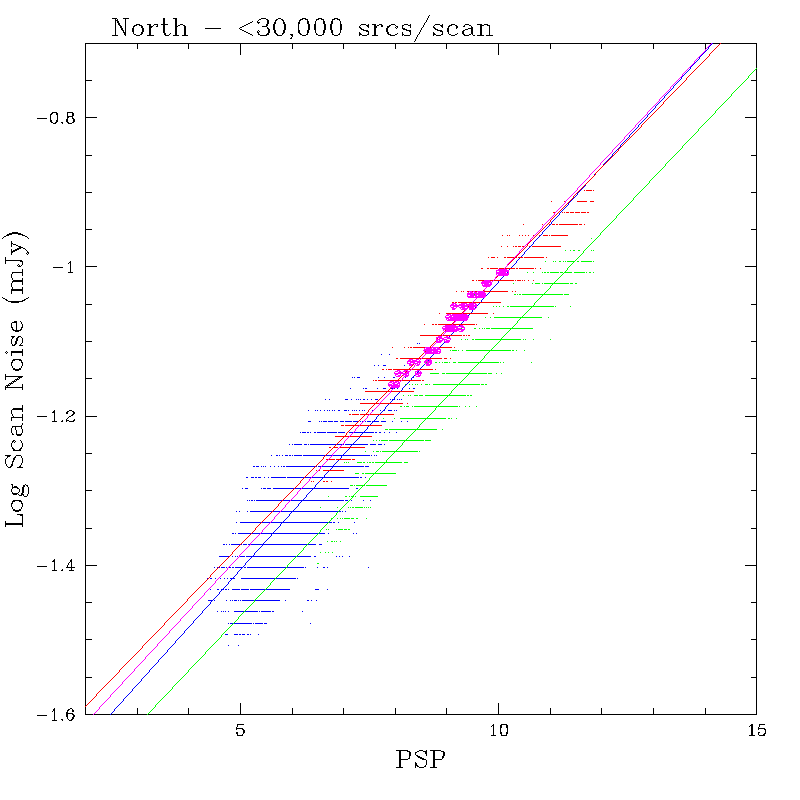
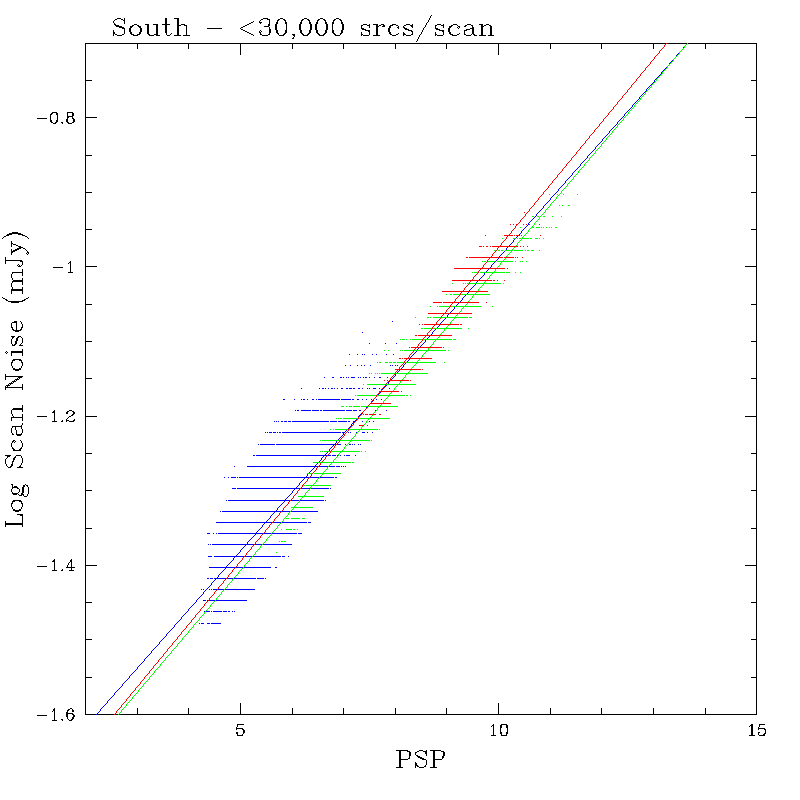
As discussed above, the Scan Noise is a proxy for the characteristic uncertainty associated with photometric measurements of faint point sources within a scan. Figures 9a and 9b show scan noise plotted as a function of PSP for 9869 northern and 14001 southern scans, respectively, taken from the final processing working scan information tables on 16 November 2001 (~35% of the full survey dataset). The plots are limited to scans that have <30,000 detections in each band to eliminate the contribution of confusion noise. The scan noise is carried in the DB to only two significant digits, hence the quantization in the plots. The J, H and Ks noise values are offset vertically in the plot for clarity. The coloring scheme is as in Figures 4a and 4b, with the new northern H-band data being shown in magenta.
The scan noise also varies linearly with PSP. Best-fits to the relation Log Noise = A*PSP + B are shown in Figures 9a and 9b, and the fit coefficients are summarized in Table 2. The slopes of the fits are consistent between bands and hemispheres. J-band exhibits the largest RMS residuals about the linear fits; the mean RMS residual about the fit is 0.04 log mJy in J, and 0.01-0.02 log mJy in H and Ks. The greatest dispersion in J occurs at the lowest noise and PSP levels, the regime where the J-band measurements are probably not fully background-limited.
 |
 |
| Figure 9a | Figure 9b |
Table 2 - Scan Noise vs. PSP Linear Fit Coefficients
| North | South | |||
| Band | A | B | A | B |
| J | 7.298629e-02 | -1.792600 | 7.858199e-02 | -1.773850 |
| H | 7.341787e-02 | -1.834508 | 8.172839e-02 | -1.816225 | H-old_array | 7.345345e-02 | -1.835340 | H-new_array | 7.517373e-02 | -1.762016 |
| Ks | 7.229011e-02 | -1.734152 | 8.420184e-02 | -1.815900 |
c. Relating Scan Noise and Repeatability Noise
Because scan noise and repeatability both vary linearly with PSP, we can easily derive the analytical form of the average relationship between the two. The ratio of scan noise and equivalent repeatability noise is given by the difference between the equivalent scan noise magnitude (Mscn) and the equivalent noise magnitude derived from the repeatability statistics (Mrepn). Mscn is related to the Scan Noise by:
where F0 is the flux for zero magnitude conversion used in the original evaluation of the scan noise (1603e3, 1075e3 and 698e3 mJy for J, H and Ks, respectively). Replacing the Log of the Scan Noise with the PSP relation gives
The noise equivalent magnitude from repeatability is given by
Replacing M10:1 with the linear relation to PSP gives for the repeatability noise magnitude:
Combining (2) and (4) gives for the difference between scan noise and repeatability noise:
or
where
and
The difference between scan noise and repeatability (i.e. random measurement noise) has some constant offset, G, and a dependence on the measurement conditions, E*PSP. The table below lists the values of E and G for the northern and southern cameras in each band. Values for the old and new northern H arrays are evaluated separately.
Table 3 - Coefficients for the Mscn - Mrepn Relation
| North | South | |||
| Band | E | G | E | G |
| J | 0.04510 | -0.22867 | 0.03525 | -0.24183 |
| H-all | 0.00135 | +0.03750 | 0.02334 | -0.22210 |
| H-old_array | 0.02793 | -0.06816 | ||
| H-new_array | 0.03527 | -0.01080 | ||
| Ks | 0.00264 | +0.05219 | 0.01532 | -0.01359 |
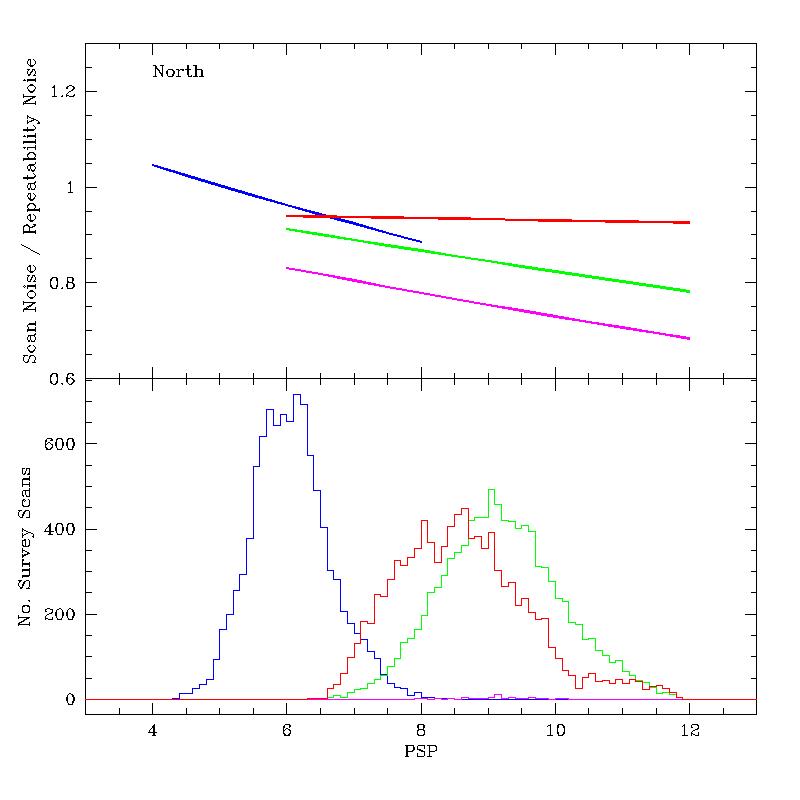
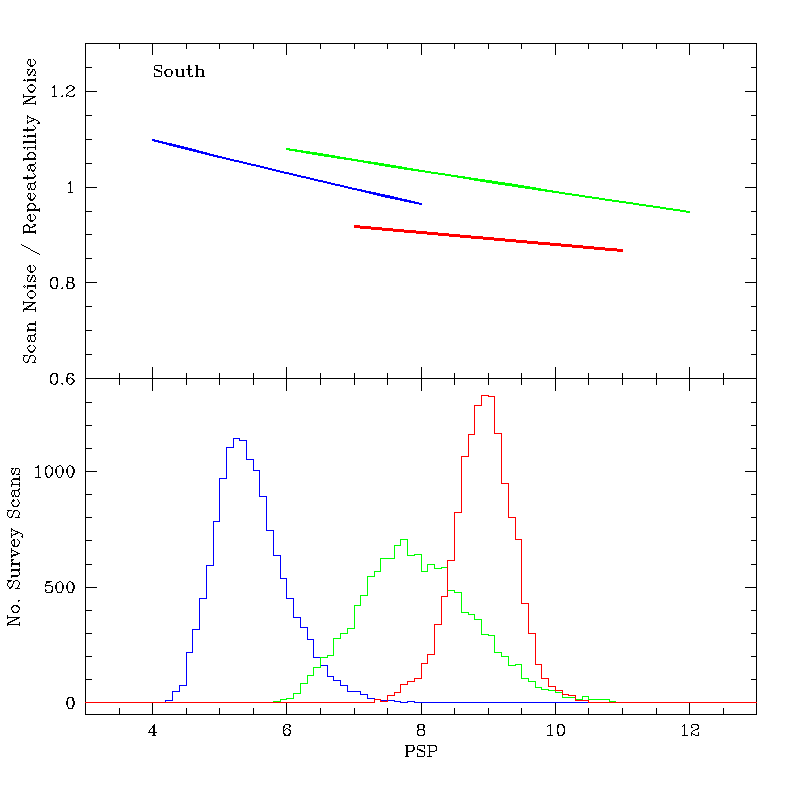
In the top panels of Figures 10a and 10b are shown for the north and south, respectively, the ratio of the Scan Noise to the Repeatability Noise plotted as a function of PSP. The curves extend over the observed range of PSP for each band. Blue and red represent J and Ks in both figures. For the north, green represents the old H-array and magenta the new array. For the south, green represents H. The bottom panels of each figure show histograms of the observed PSP values for all survey scans currently in the working database.
For the northern camera, the J scan noise ranges from ~5% larger than the repeatability noise in the best conditions to ~10% lower in the worst. For the most common PSP values, the scan noise is slightly lower than the repeatability noise. The noise ratio ranges from 0.9 to 0.8 for the old northern H array, and 0.85 to 0.7 for the new array. The noise ratio in Ks is relatively constant over most conditions in the north, with the Ks scan noise ~7% lower than the repeatability noise.
The ratio of scan to repeatability noise varies weakly with PSP in all bands for the southern camera. For the most common conditions, the J and scan noise are ~5% above the repeatability noise, while in Ks, the scan noise is ~10% lower than the repeatability noise.
 |
 |
| Figure 10a | Figure 10b |
Last Updated: 20 November 2001
R. Cutri - IPAC