
Carbon Dioxide in R Leonis
Date
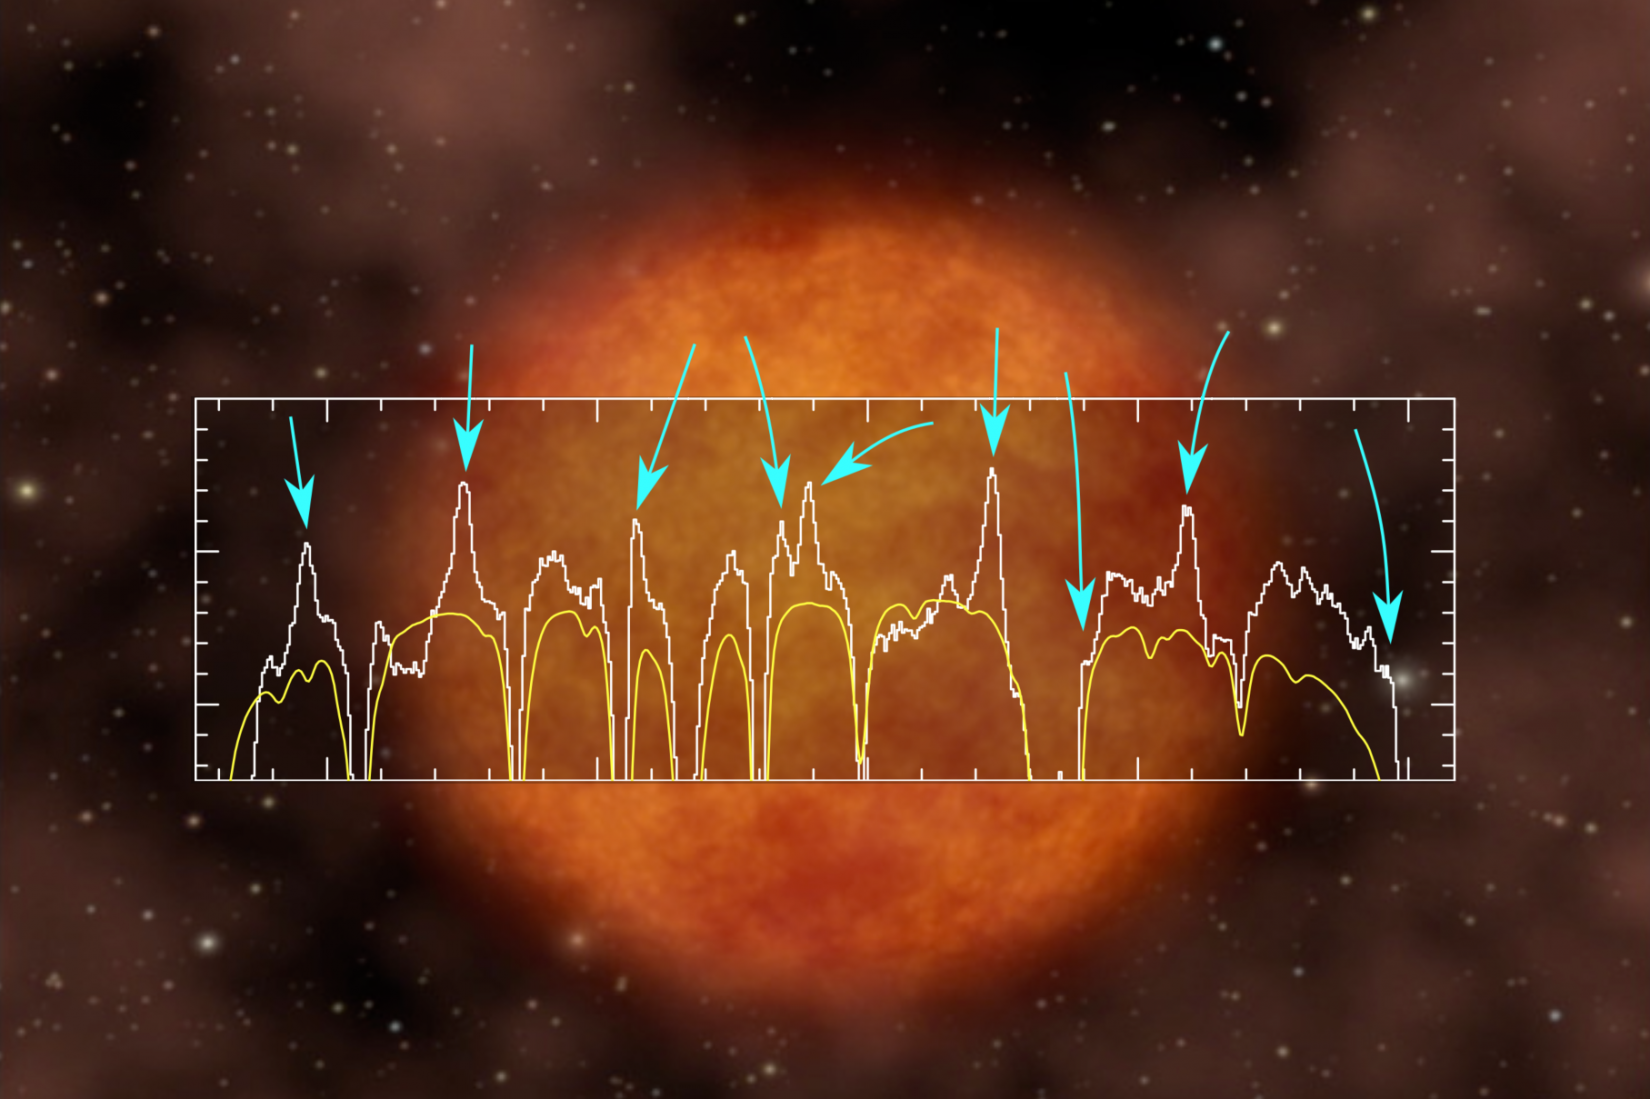
A portion of the spectrum of R Leonis (white) superimposed on an artistic interpretation of the star. The arrows indicate several CO₂ emission line peaks near 13.5 µm, and the yellow line is a model of Earth’s atmospheric transmission.
Credit
NASA/JPL-Caltech; Fonfría et al. 2020
Image Number
SCI2021_015