Scientific Observations Gallery
| Title | Image |
|---|---|
|
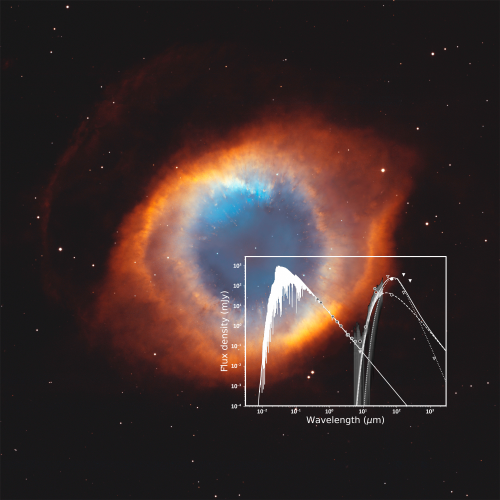
Disruption of a Planetary System
Caption
The spectral energy distribution of WD 2226-210 superposed on an image of the Helix Nebula from Hubble Space Telescope. The plot combines optical, infrared, and millimeter photometry, the Spitzer mid-infrared spectrum, and upper limits from WISE, Spitzer, SOFIA, Herschel, and ALMA. Models of the white dwarf photosphere (solid) and IR excess showing good fits to the data detections (circles) and upper limits (triangles).
Credits
Helix Nebula: NOIRLab; SED: J. P. Marshall.
|
|
|
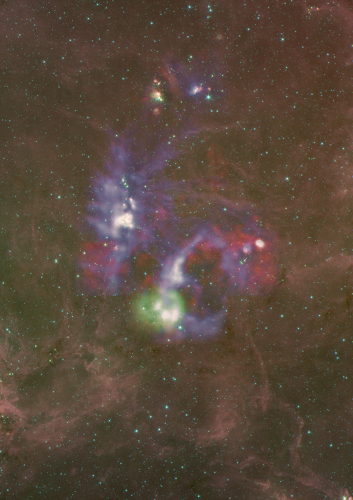
SOFIA Helps Complete Picture on Molecular Cloud Formation
Caption
Composite image of Cygnus X obtained by NASA’s Spitzer Space Telescope, with SOFIA’s upGREAT ionized carbon data overlaid in blue, green, and red. The three colors represent material moving at different velocities: -10 to 4 km/s for blue, 4-12 km/s for green, and 12-20 km/s for red.
Credits
NASA/JPL-Caltech/SOFIA
|
|
|
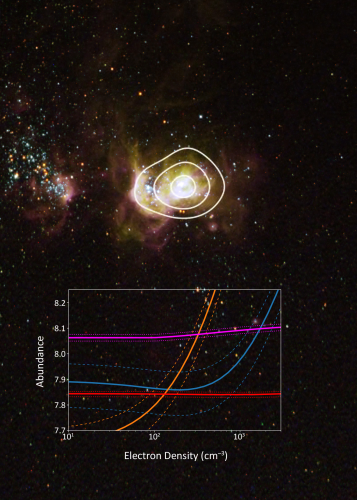
The Abundance Discrepancy Factor in Markarian 71
Caption
Plot of the measured oxygen abundance [12+log(O/H)] from different emission lines as a function of electron density overlaid on an image of Mrk 71 from HST/WFC3 archival data with [OIII] 52 µm contours from SOFIA/FIFI-LS. The intersection of the [O III] 52 µm (blue) and [O III] 88 µm (orange) curves is consistent with the optical collisionally excited line metallicity (red), not the recombination-line metallicity (magenta), providing direct evidence that temperature fluctuation is not the main cause of ADF in this object.
Credits
NASA/ESA/Hubble/Chen et al., 2023
|
|
|
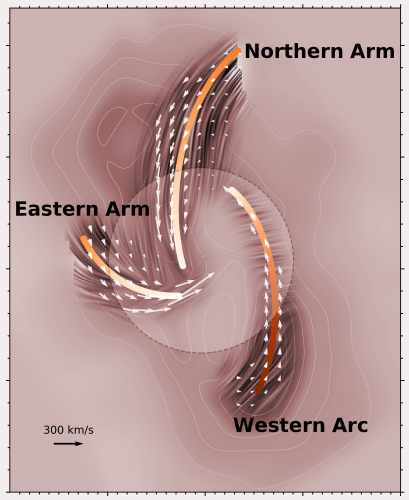
Magnetically-Structured Accretion in the Galactic Center’s Circumnuclear Disk
Caption
The Circumnuclear Disk in the Galactic center as observed by SOFIA/HAWC+. The magnetic field streamlines from the polarization data are shown superposed on the 53-μm intensity map with an angular resolution of ~5 arcsec. White vectors represent the direction and magnitude of the shear flows in each of the streamers of ionized material. Magnetic field strength along the flow direction is depicted by the color-coded stripes with values ranging from 0.9 mG (light) to 27 mG (dark). The star shows the position of Sgr A*. The dashed circle represents the approximate boundary between the magnetic-dominated region (outside) and the gas-dominated region (inside).
Credits
Guerra et al., 2023
|
|
|
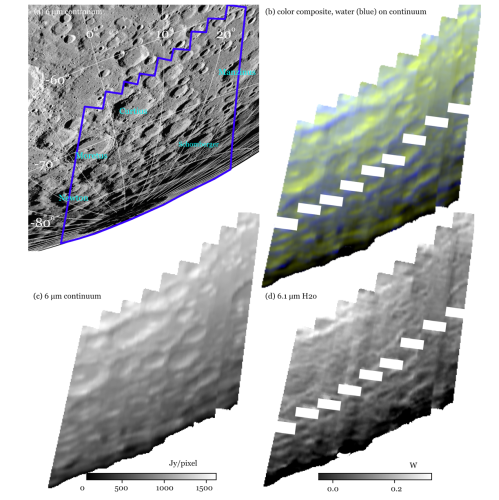
Mapping Water on the Lunar Surface
Caption
(a) Lunar Reconnaissance Orbiter Wide Angle Camera image of the southern limb of the Moon, oriented with the celestial pole at the top as appropriate for 2022 February 17, with lunar coordinate grid overlaid and an outline of the region observed with SOFIA (blue lines). (b) Color rendition of SOFIA water and continuum emission. The color image combines the 6 micron continuum surface brightness (green) and the 6 micron water feature strength (blue). The diagonal empty regions on the water image mask a partially transparent defect on the surface of the detector that leads to significantly higher noise. (c) The 6 µm continuum surface brightness in Jy/pixel. (d) The 6 micron integrated water band strength, W.
Credits
Reach et al., 2023
|
|
|
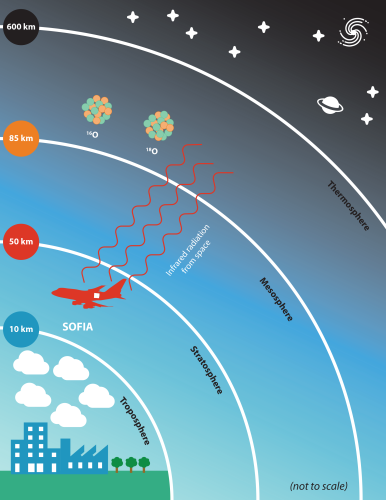
SOFIA Makes First Detection of Heavy Oxygen in Earth’s Upper Atmosphere
Caption
This schematic shows the layers of Earth’s atmosphere, from the troposphere to the thermosphere. SOFIA observes from within the stratosphere and studied the ratio of main oxygen to heavy oxygen in the mesosphere and lower thermosphere, up to an altitude of about 124 miles (200 kilometers.)
Credits
NASA/SOFIA/L. Proudfit
|
|
|
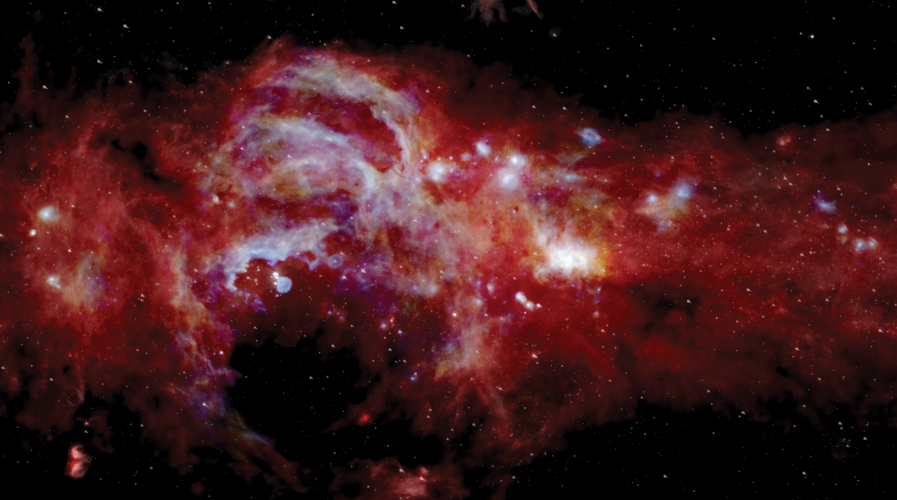
The SOFIA/FORCAST Galactic Center Legacy Program
Caption
Composite infrared image of the center of our Milky Way galaxy, spanning 600+ light-years across. New data from SOFIA taken at 25 and 37 µm, shown in blue and green, is combined with data from the Herschel Space Observatory, shown in red (70 µm), and the Spitzer Space Telescope, shown in white (8 µm). SOFIA’s view reveals features that have never been seen before.
Credits
NASA/SOFIA/JPL-Caltech/ESA/Herschel
|
|
|
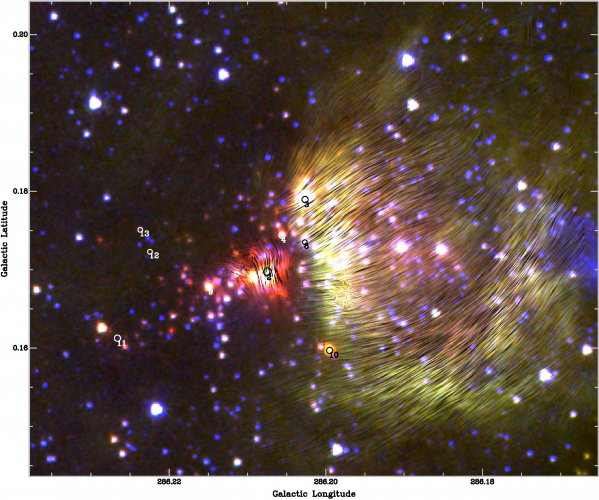
Formation of Massive Star Caught in the Act with Magnetic Field Mapping
Caption
The magnetic field orientations of BYF 73, as derived from SOFIA data, are overlain on a composite image of the region taken by the Spitzer Space Telescope and Anglo-Australian Telescope. The circled areas are locations of protostars in the region identified by ALMA and the Gemini Observatory. These studies help astronomers uncover the relationship between magnetism and gravity in star formation.
Credits
NASA/Spitzer/SOFIA/ALMA/Gemini/AAT/Barnes et al.
|
|
|
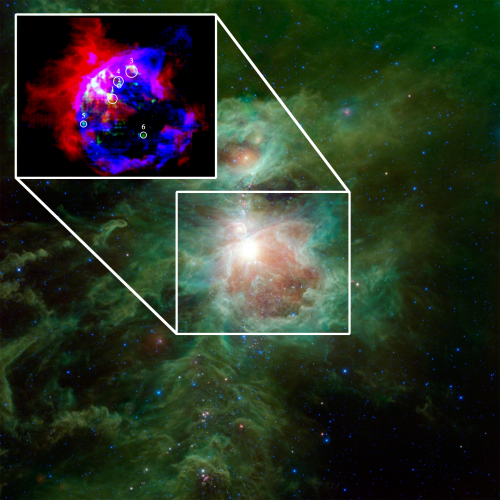
SOFIA Helps Reveal Why Cosmic Bubbles Are Leaking Out Into Space
Caption
The background image shows the Orion nebula taken by the Wide-field Infrared Survey Explorer. Orion’s Veil shell is toward the center of this image, and the callout from this area shows a map of ionized carbon emission from the bubble measured by SOFIA. White circles in the callout indicate the position and size of shock-accelerated ionized carbon-emitting gas, which affect the morphology of the shell.
Credits
Orion nebula: NASA/JPL-Caltech/WISE Team; Callout: NASA/SOFIA/Kavak et al.
|
|
|
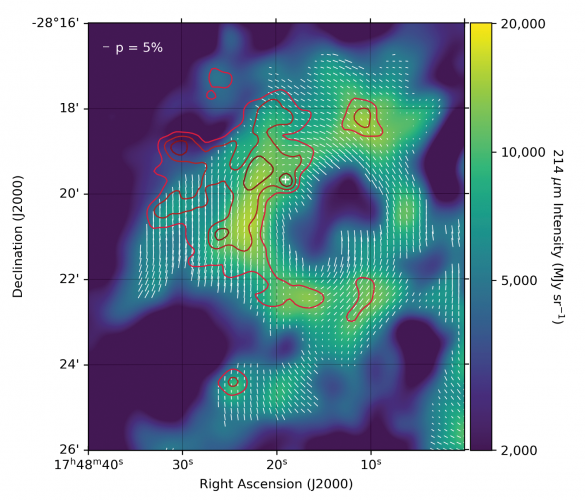
SOFIA/HAWC+ 214 µm emission of the Ring
Caption
SOFIA/HAWC+ 214 µm emission of the Ring (M0.8-0.2), overlaid with the magnetic field directions (white pseudovectors). The white “+” shows the location of a point source that may be responsible for driving the expansion. Red contours show the 3mm (90 GHz) MGPS data at 10 sigma, 15 sigma, 20 sigma levels (0.5 mJy/beam). The magnetic field geometry is suggestive of a field that is compressed by the expansion of a shell of material. This expansion/compression interpretation implied by the magnetic field measurements is consistent with molecular gas kinematics (e.g., Mills & Battersby 2017).
Credits
Butterfield et al.
|
|
|
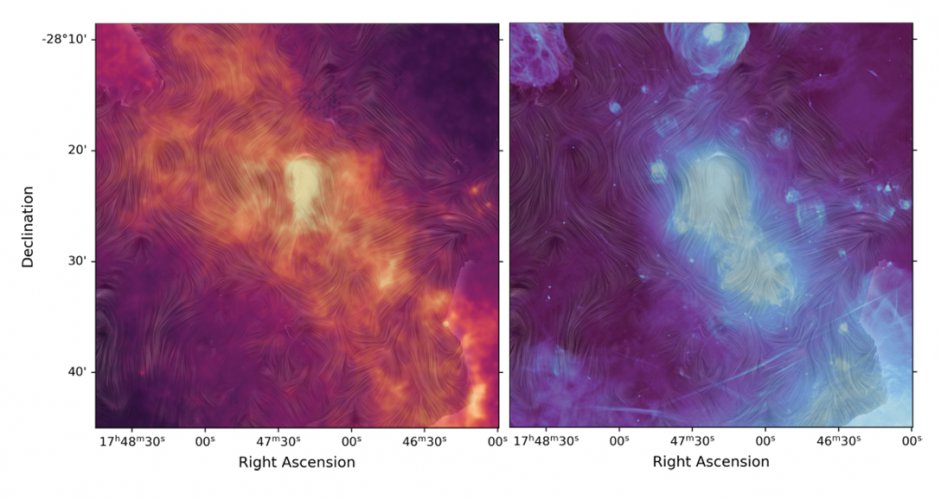
The Galactic Center Magnetosphere
Caption
Magnetic fields inferred from the FIREPLACE pilot study are shown superposed on Herschel 250 um data (left) and MeerKAT 1 GHz data (right). Non-thermal filaments (NTFs) that run perpendicular to the galactic plane can be seen in the lower right part of the image on the right.
Credits
Left: Herschel/SPIRE/Molinari et al., background; Butterfield et al., magnetic fields; Right: MeerKAT/Heywood et al., background; Butterfield et al., magnetic fields
|
|
|
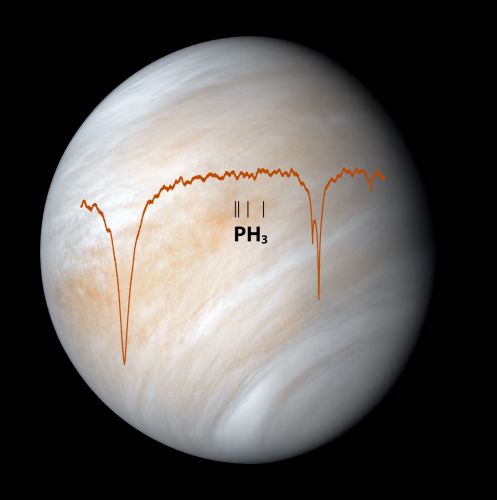
No Phosphine on Venus, According to SOFIA
Caption
The spectral data from SOFIA overlain atop this image of Venus from NASA’s Mariner 10 spacecraft is what the researchers observed in their study, showing the intensity of light from Venus at different wavelengths. If a significant amount of phosphine were present in Venus’s atmosphere, there would be dips in the graph at the four locations labeled “PH 3 ,” similar to but less pronounced than those seen on the two ends.
Credits
Venus: NASA/JPL-Caltech; Spectra: Cordiner et al.
|
|
|
Stellar Feedback and Triggered Star Formation in RCW 120
Caption
Composite image of the nebula RCW 120. The newly formed O star is moving at ~4 km/s toward the South, sweeping up a dense shell of gas with a bow shock at the bottom and broken open at the top. The ring-shaped clouds around the nebula were detected by the Spitzer Space Telescope. SOFIA measured the glowing gas shown in red and blue to study the nebula’s expansion speed and determine its age. The blue and red gas represent, respectively, emission at velocities between -23 and -16 km/s, expanding in the direction toward Earth, and -1 and +3 km/s, expanding away from Earth. The expansion of this shell has triggered the birth of stellar neighbors at breakneck speeds – and reveals that the nebula is younger than previously believed.
Credits
NASA/JPL-Caltech/SOFIA
|

|
|
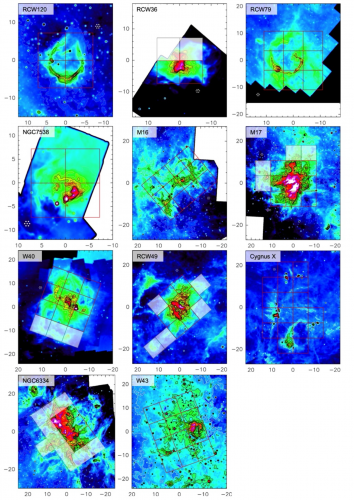
Feedback Source Sample
Caption
Feedback source sample. The red boxes outline the tiles proposed to be observed for each source. The slightly opaque ones were not observed. Colored background: The IRAC 8μm map of the sources tracing the PDRs in these regions convolved to the 14” upGREAT beam. Contours are predicted [CII] 1.9 THz integrated line intensity based upon the [CII]-8 μm relation derived for L1630, Orion, and 30 Dor. Contour levels are: white dashed (50 K km/s), white (100 K km/s), black (150(50)400 K km/s), red (500 K km/s), blue (1000 K km/s). Box units are in arcmin. The upGREAT 7 beam pattern is plotted alongside the outlined area in each box, illustrating that much finer detail than visible in these images can be traced.
Credits
Robert Simon, University of Cologne
|
|
|
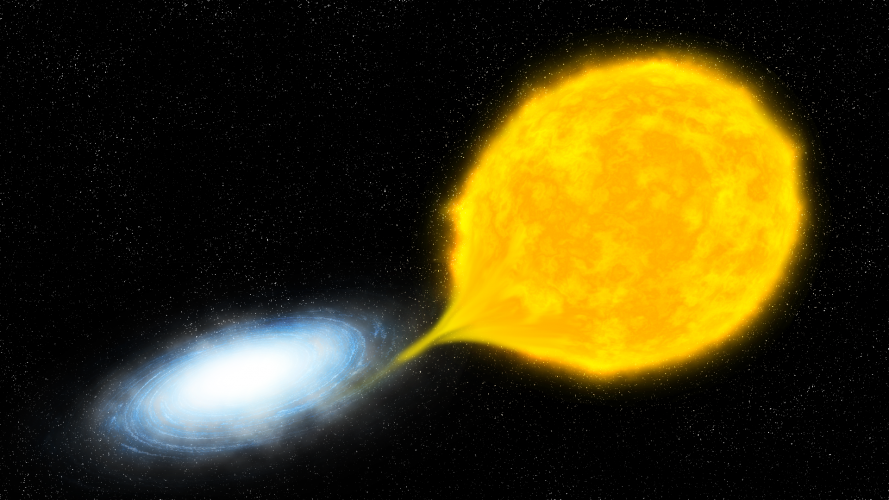
SOFIA Spies a New Type of Stellar Outburst
Caption
Caption: Artist’s rendition of a cataclysmic variable in which a white dwarf (white/blue) is accreting material from its nearby Sun-like companion (yellow). The material forms a disk around the white dwarf until an instability causes an explosion and a bright outburst of light, known as a nova.
Credits
NASA/SOFIA/L. Proudfit
|
|
|
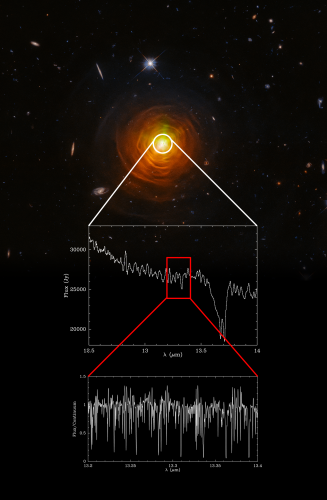
The SOFIA/EXES Mid-IR High Spectral Resolution Library
Caption
Hubble Space Telescope image of IRC+10216 together with a small portion of the SOFIA/EXES high-resolution spectrum around 13.3 µm. The low-resolution spectrum taken with the Infrared Space Observatory is similar to the results expected from JWST.
Credits
ESA/Hubble, NASA, and Toshiya Ueta (University of Denver), Hyosun Kim (KASI); Cernicharo et al., 1999; Montiel et al. (in prep); Fonfría et al (in prep)
|
|
|
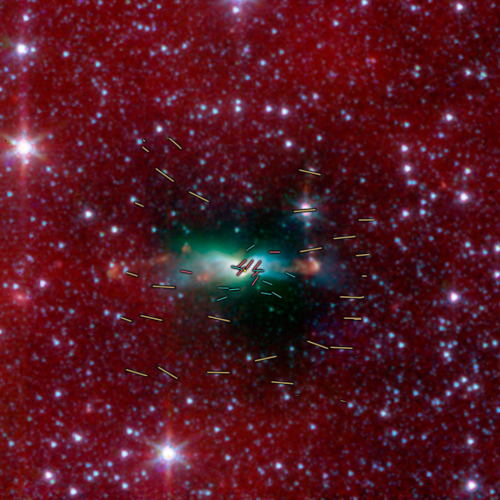
Lynds 483 Polarization Vectors
Caption
A subset of polarization vectors are overlain atop a Spitzer Space Telescope image of Lynds 483. The SOFIA data is shown in red, and the orange vectors were obtained by Pico dos Dias Observatory. The green vectors show data obtained by SHARC C-II Polarimeter at the Caltech Submillimeter Observatory in previous work, shown here as a comparison of scales. Near the center of the image is a small yellow dot indicating the location of the binary protostars. The combined fields show a twist as they approach the protostellar envelope, though they are parallel on larger scales.
Credits
L483: NASA/JPL-Caltech/J. Tobin; Vectors: Cox et al. 2022, Chapman et al. 2013
|
|
|
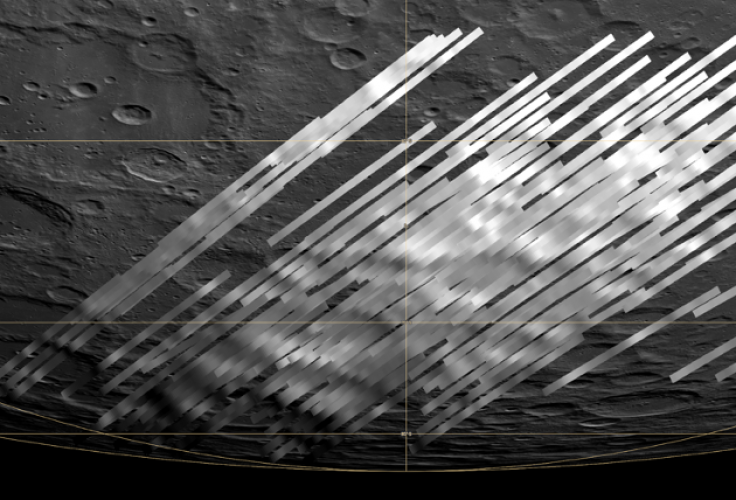
Water on the Moon 2022
Caption
Orthographically rectified images of average flux (a) and emission peak height (b).
Credits
Honniball et al. 2022
|
|
|
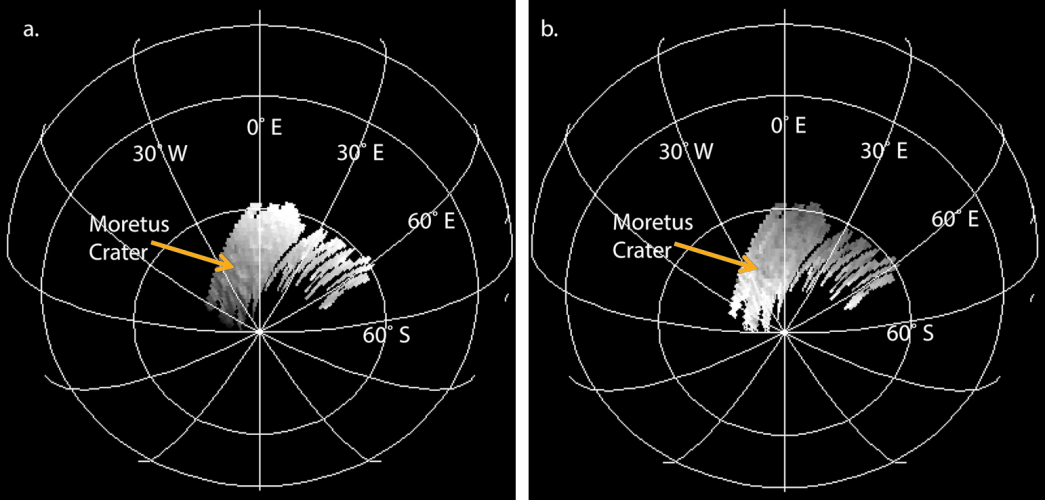
Water Abundances in the Moon’s Moretus Crater Region
Caption
The image shows flux data obtained by SOFIA’s FORCAST instrument overlaid on an orthographic projection of the Moon, creating a map of water abundances in the Moretus Crater region. Surface lunar features are clearly visible within the flux data. In this image, lighter colors correspond to a higher flux, and darker corresponds to a lower flux.
Credits
Honniball et al. and Applied Coherent Technology Corp. The Moon reference image is constructed using the LRO-WAC albedo mosaic.
|
|
|
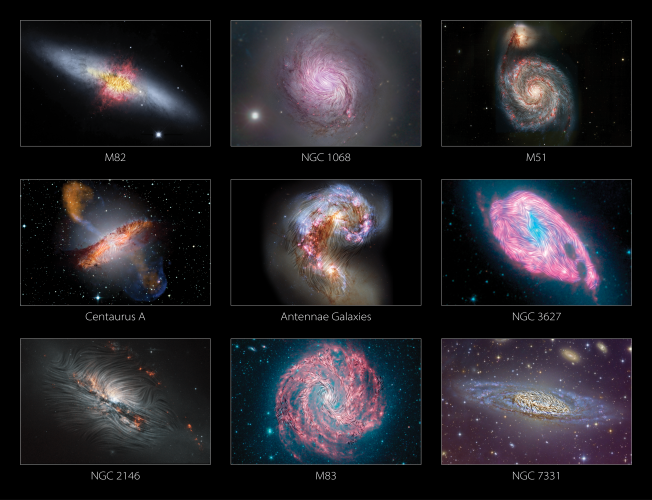
Magnetic Fields - A Ubiquitous Part of Galaxy Ecosystems
Caption
The magnetic fields of spiral (M51, M83, NGC 3627, NGC 7331), starburst (M82, NGC 2146), active galactic nuclei (NGC 1068 and Centaurus A), and merging (Antennae galaxies) galaxies obtained by SALSA (Survey of extragALactic magnetiSm with SOFIA). Results are published in The Astrophysical Journal ( SALSA IV: Lopez-Rodriguez et al. ).
Credits
M82: NASA/SOFIA/E. Lopez-Rodriguez; NASA/Spitzer/J. Moustakas et al.; NGC 1068: NASA/SOFIA; NASA/JPL-Caltech/Roma Tre Univ.; M51: (NASA, the SOFIA science team, A. Borlaff; NASA, ESA, S. Beckwith (STScI) and the Hubble Heritage Team (STScI/AURA)); Centaurus A: Optical: European Southern Observatory (ESO) Wide Field Imager; Submillimeter: Max Planck Institute for Radio Astronomy/ESO/Atacama Pathfinder Experiment (APEX)/A.Weiss et al.; X-ray and Infrared: NASA/Chandra/R. Kraft; JPL-Caltech/J. Keene; SOFIA; Antennae galaxies: ESA/Hubble & NASA/E. Lopez-Rodriguez; NGC 3627: NASA/JPL-Caltech/R. Kennicutt (University of Arizona) and the SINGS Team/E. Lopez-Rodriguez; NGC 2146: ESA/Hubble & NASA/E. Lopez-Rodriguez; M83: NASA/JPL-Caltech/E. Lopez-Rodriguez; NGC 7331: Vicent Peris, CC BY-SA 2.0/E. Lopez-Rodriguez
|
|
|
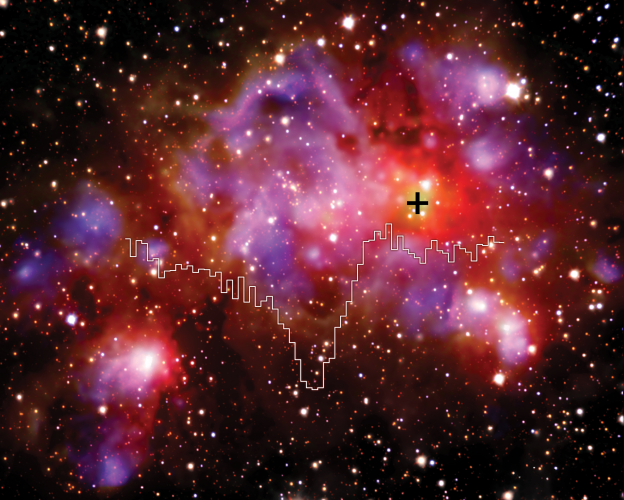
Deuterated Hydroxyl as a Star Formation Tracer
Caption
The two-component OD absorption spectrum from GREAT superposed on a three-color image of W49A; SOFIA-FORCAST 20 μm (blue), SOFIA-FORCAST 37 μm (green), and Herschel-PACS 70 μm (red). Stars are from Spitzer-IRAC 3.6 μm (white). The plus sign marks the position of the spectrum.
Credits
De Buizer et al. 2021/SOFIA/Herschel/ESO/Csengeri et al. 2022
|
|
|
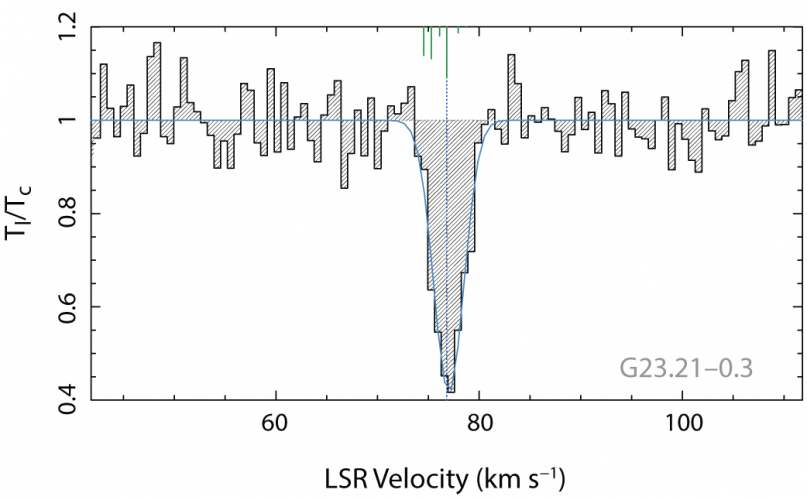
OD spectrum for G23.21-0.3
Caption
The line-to-continuum ratio for the OD 2 Π 3/2 ground-state (J = 5/2-3/2) towards the quiescent source G23.21-0.3.
Credits
Csengeri et al. 2022
|
|
|
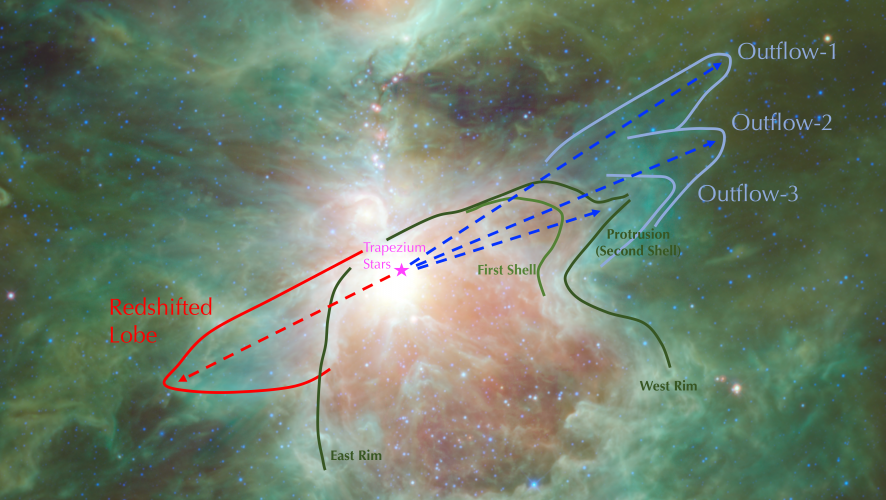
Orion’s Veil Protrusion
Caption
Schematic picture of the protrusion (green lines, center right) and outflows of ionized carbon extending beyond the protrusion — where the shell has likely been pierced — overlaid on a Wide-field Infrared Survey Explorer image of the region.
Credits
NASA/JPL-Caltech/WISE Team; Kavak et al.
|
|
|
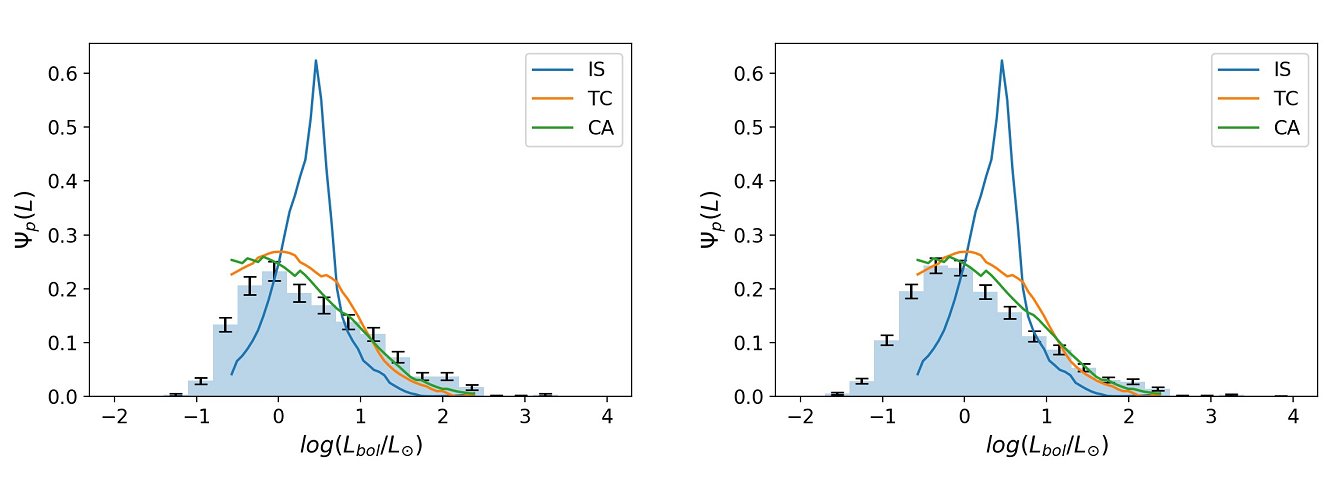
Observed protostellar luminosity function for Cygnus X overlaid with theoretical models
Caption
Observed protostellar luminosity function for Cygnus X overlaid with theoretical models. The blue histograms show the observations. The blue curve represents the isothermal-sphere model, which clearly does not fit the observations. The turbulent-core (orange) and competitive-accretion (green) models both reproduce the general characteristics of the observations.
Credits
Cheng et al. 2022
|
|
|
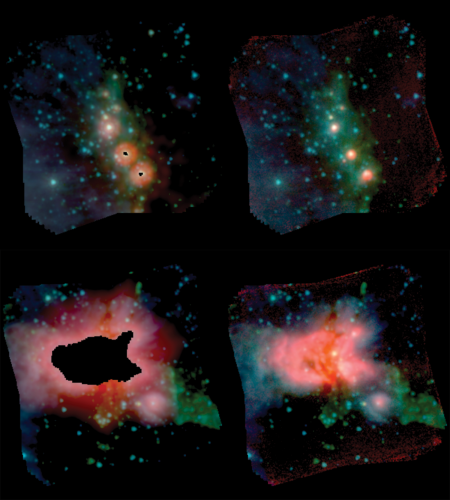
The Cygnus X Protostellar Luminosity Function
Caption
RGB images of Cygnus X sub-regions with R=Spitzer MIPS 24 band (left) and SOFIA FORCAST 31 band (right) showing that bright, clustered regions can be completely saturated in the MIPS data, while clearly revealed by SOFIA FORCAST. The upper pair shows the saturated cores and strong halos of bright sources. The lower pair shows a close-up of a saturated area of extended nebulosity.
Credits
Cheng et al. 2022
|
|
|
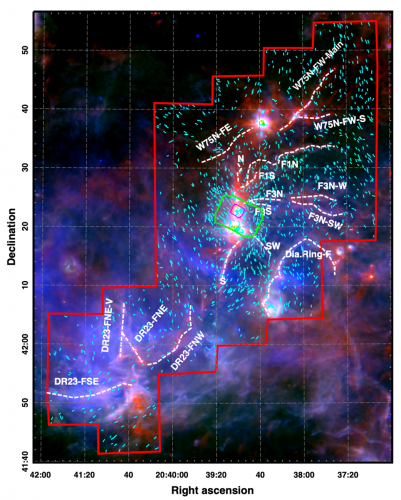
Cygnus-X Magnetic Fields
Caption
Cygnus-X northeast region. Background image was constructed from Herschel SPIRE 250um in red, Herschel PACS 70um in green, and Spitzer MIPS 24um in blue. Red polygon indicates region surveyed for near-infrared, H-band (1.6um) stellar polarizations. Cyan segments indicate the magnetic field orientations derived from those NIR polarizations. Dashed white curves highlight filaments and sub-filaments cataloged by Hennemann et al. (2012) and new filaments and subfilaments from this study. The green polygon shows the DR21 Ridge region surveyed using SOFIA HAWC+ E-band (214um) polarization and the inscribed smaller magenta polygon shows the corresponding HAWC+ A-band (52um) polarization surveyed region.
Credits
Herschel/Spitzer/SOFIA/Hennemann et al./Clemens et al.
|
|
|
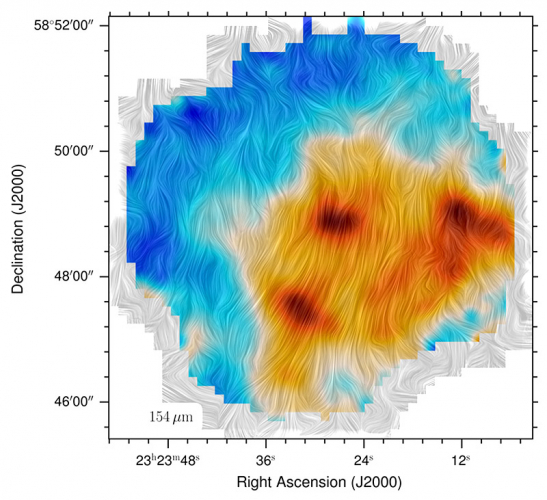
Supernova remnant Cassiopeia A with Magnetic Fields
Caption
The magnetic field directions are shown on the SOFIA far-IR (154 micron) image using the High-Resolution Airborne Wideband Camera Plus (HAWC+) on board SOFIA. The magnetic field strength in Cas A is very strong, 100 milli-Gauss inferred by the polarization measurements. The polarization is relatively weak where the far-infrared emission is stronger (in brown).
Credits
NASA/SOFIA
|
|
|
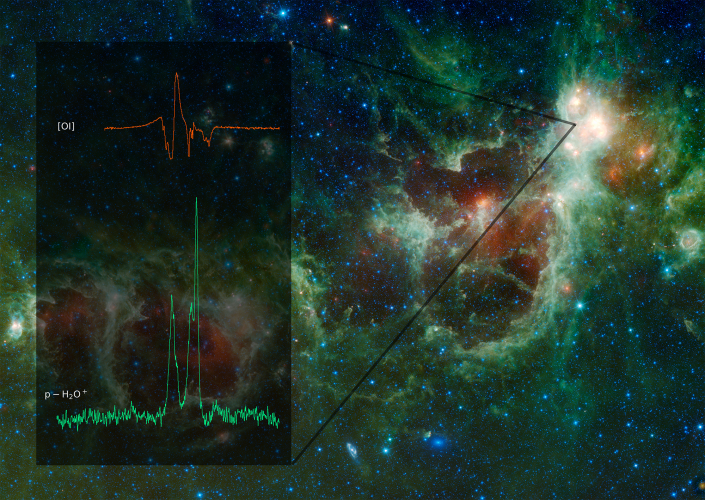
Heart and Soul Nebulae with Spectra
Caption
W3, one of the 25 Milky Way regions the HyGAL project will study, is seen as the glowing white area in the upper right of this image of the Heart and Soul Nebulae, taken by NASA’s Wide-field Infrared Survey Explorer (WISE). SOFIA looked at the abundances of six hydride molecules in W3, the spectra of two of which are shown in the box at left.
Credits
Nebulae: NASA/JPL-Caltech/UCLA; Spectra: Jacob et al.
|
|
|
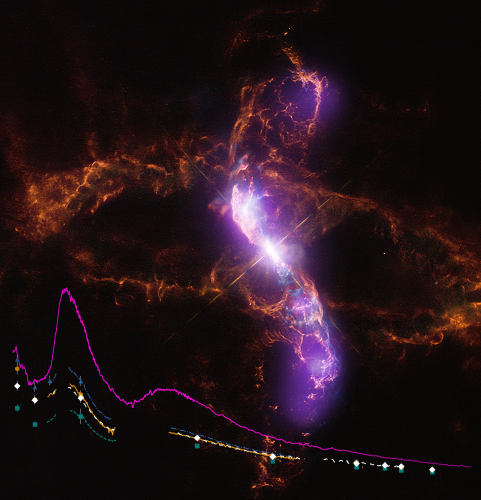
R Aquarii with Spectra
Caption
This composite image of R Aquarii resembles a ring of fire over a black field, with a glowing purple “S” flowing through it. Near the center of the image, in the middle of the ring and the “S” wave, is a twinkle of bright white, which is the Mira variable in R Aquarii. The white dwarf is very faint and contributes very little to the optical emission. However, the purple wave is the result of a jet that is powered by the white dwarf accreting dust produced by the Mira variable. The smokey red circles are evidence of explosive events that occurred several hundred years ago. Overlain atop the composite image of R Aquarii is a set of five plots indicating the energy emitted by the system. SOFIA acquired four of the data sets, while the strong purple plot is data from the Infrared Space Observatory from 1996, when R Aquarii’s emission was strongest. The strength also depends on the phase of the binary star system’s eclipse, so it does not increase each successive year, exactly: the flux fell between 2018 and 2019.
Credits
NASA/CSC/SAO/STScI/Palomar Observatory/DSS/NSF/NRAO/VLA/LCO/IMACS/MMTF/Sankrit et al.
|
|
|
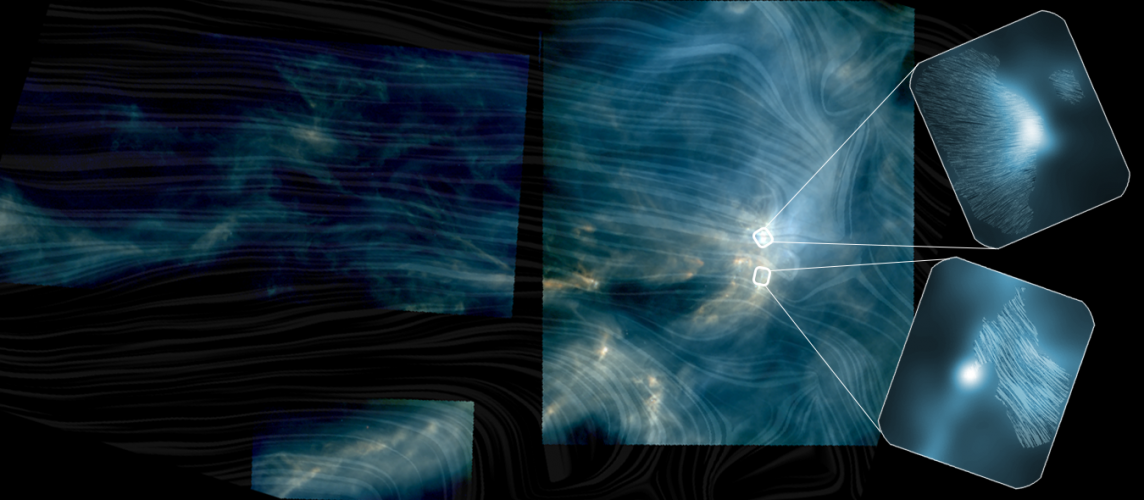
Constraining Magnetic and Gravitational Energies in Star-Forming Clouds
Caption
The magnetic streamlines from Planck superposed on a three-color image of the Rho Ophiuchi cloud complex from Herschel. The higher-resolution insets from SOFIA/HAWC+ show clearly that the streamlines are oriented perpendicular to the structure.
Credits
ESA/Herschel/Planck; J. D. Soler, MPIA; Lee et al. 2021
|
|