Observed protostellar luminosity function for Cygnus X overlaid with theoretical models
Date
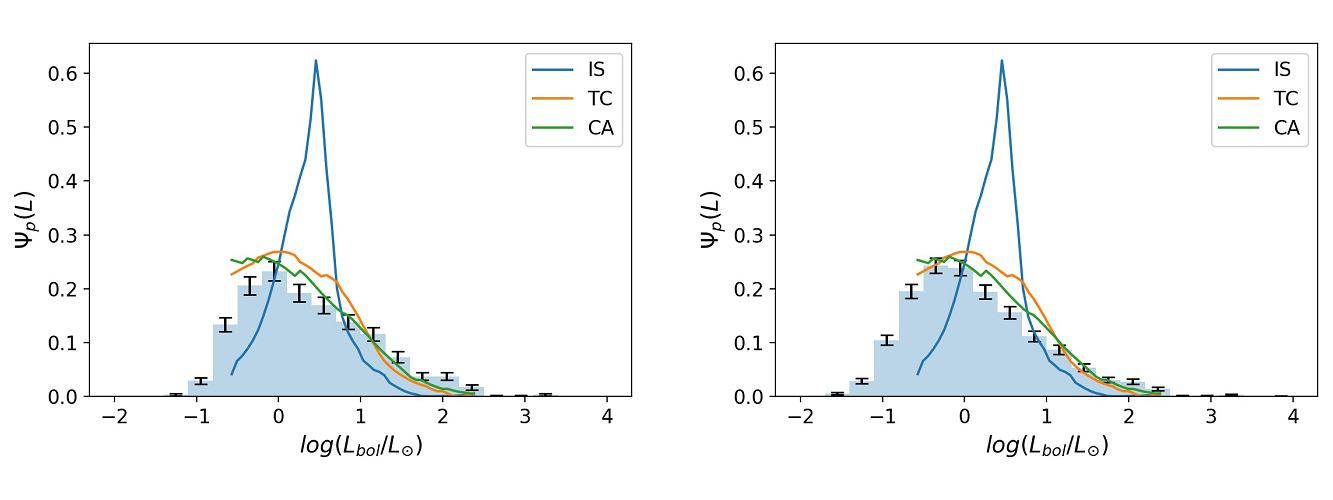
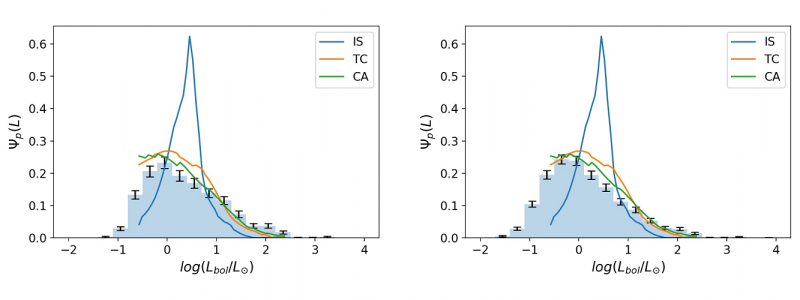
Observed protostellar luminosity function for Cygnus X overlaid with theoretical models. The blue histograms show the observations. The blue curve represents the isothermal-sphere model, which clearly does not fit the observations. The turbulent-core (orange) and competitive-accretion (green) models both reproduce the general characteristics of the observations.
Credit
Cheng et al. 2022
Image Number
SCI2022_0008
Additional Information
Observed protostellar luminosity function for Cygnus X overlaid with theoretical models
Instrument
FORCAST
More Information