![Ratios of [C II] over far-IR emission as a function of the infrared surface brightness](/data/SOFIA/docs/sites/default/files/2021-12/SCI2021_0026.png "Ratios of [C II] over far-IR emission as a function of the infrared surface brightness")
Ratios of [C II]
Date
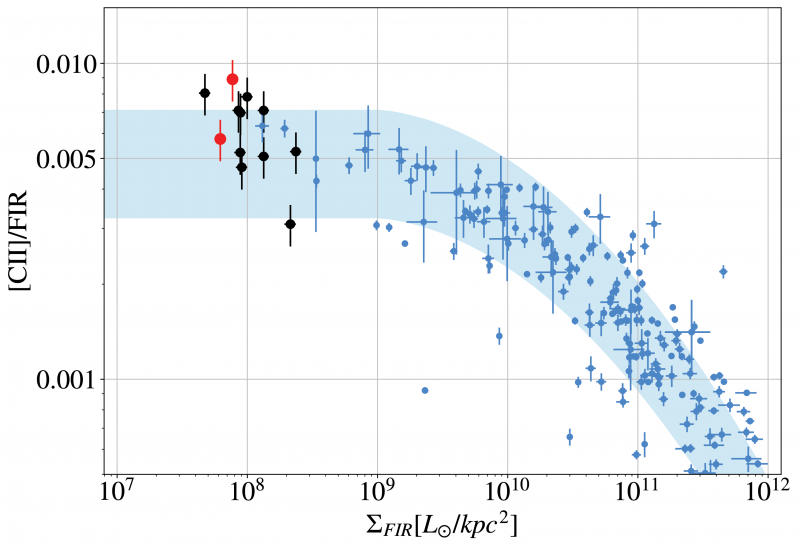
Ratios of [C II] over far-IR emission as a function of the infrared surface brightness. The blue symbols depict observations from a comparison sample (Diaz–Santos et al. 2017) and the shaded band is the fitted curve with 1-σ uncertainty showing the zone where the [C II] emission is compatible with star formation. The black and red symbols represent the data for the northern and southern counter-arm regions, respectively.
Credit
Fadda et al. 2021
Image Number
SCI2021_0026
Additional Information
Ratios of [C II]
Instrument
FIFI-LS
More Information