
SOFIA Sees Super-Heated Gas Streams Churning up Possible Storm of New Stars
Date
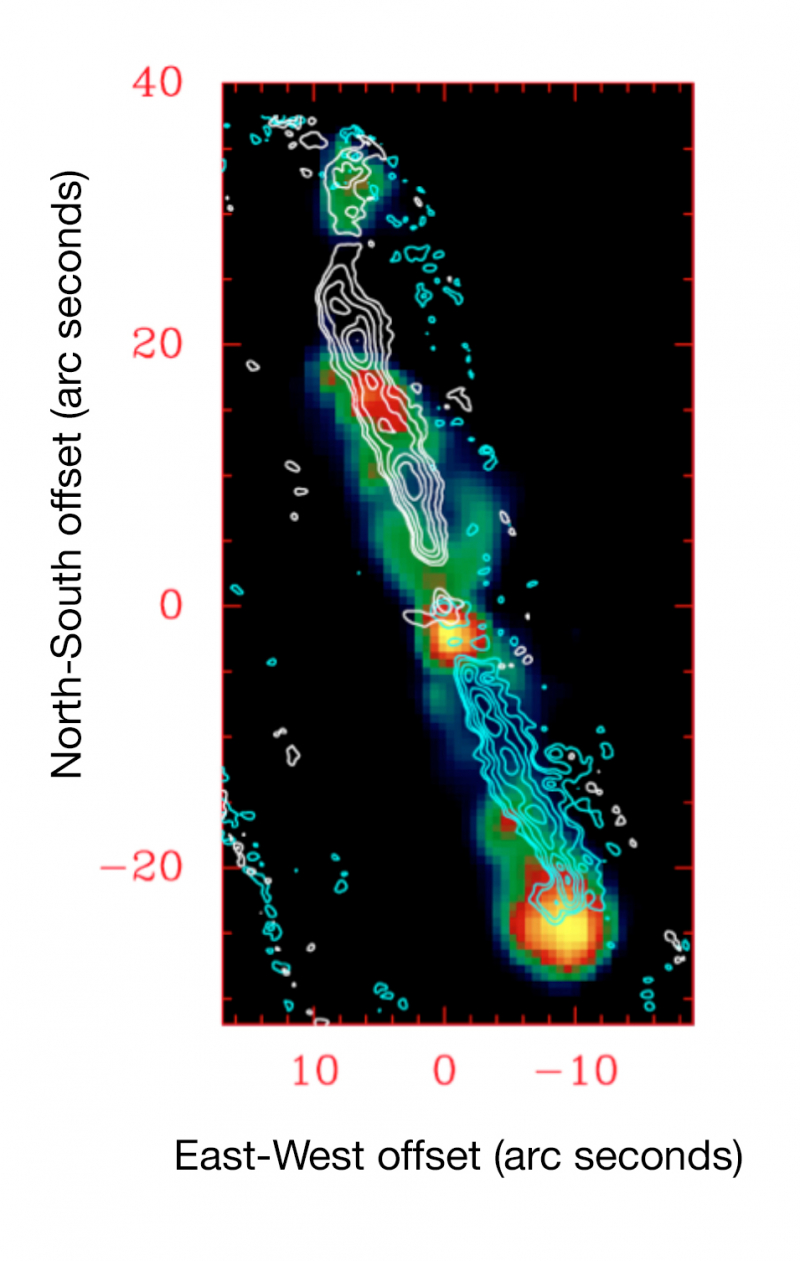
Map of Cepheus E emphasizing the jets of material flowing to the upper left and lower right from the protostar. The protostar itself is the central yellow-red 'blob" in the colored background map of hydrogen emission made at a wavelength of 4.5 microns by the Spitzer infrared space telescope. The contour curves show the strength of emission from cool carbon monoxide gas measured by the Plateau de Bure radio telescope located in the French Alps. Lefloch et al. used GREAT on SOFIA to measure the amount and velocity of hot carbon monoxide gas at multiple positions along both "wings" of the outflow jet.
Credit
Lefloch et al. 2015 Figure 1
Image Number
SCI2016_0006
Additional Information
SOFIA Sees Super-Heated Gas Streams Churning up Possible Storm of New Stars
Principal Investigator
A. Gusdorf
Instrument
GREAT