![Spectrum of emissions where integrated intensity of [CII] is strongest in Large Magellanic Cloud](/data/SOFIA/docs/sites/default/files/Public/SCI2020_0004.png "Spectrum of emissions where integrated intensity of [CII] is strongest in Large Magellanic Cloud")
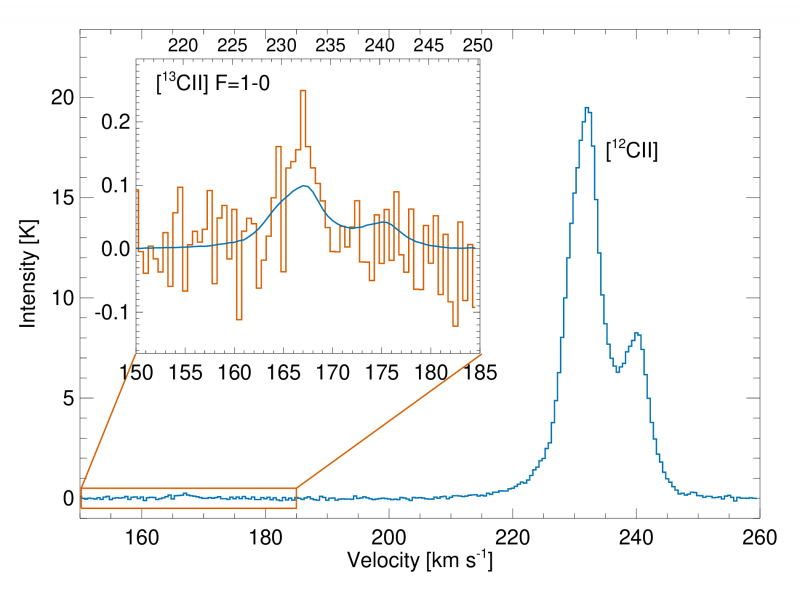
Spectrum of the [ 12 CII] and [ 13 CII] emission at the position where the integrated intensity of [CII] is strongest in the star-forming region N159W in the Large Magellanic Cloud. The blue line overlaid on the [ 13 CII] spectrum is the scaled [ 12 CII] emission that would be expected if the [ 12 CII] emission were optically thin. The observed intensity of [ 13 CII] is stronger than the scaled [ 12 CII], indicating that the [ 12 CII] emission is optically thick.
Additional Information
Spectrum of the [^12CII] and [^13CII] emission
United States