The basic steps of point source extraction with APEX are as follows:
Mosaicking
In APEX Single Frame, the processing is done on a single frame, so this step is not carried out. In APEX Multiframe, the first step is to mosaic the input images to create a single combined image that can be used for source detection (unless this has been done in a pre-pended Mosaic pipeline).
Background Subtraction
The MedFilter module performs background estimation in the input images, and outputs background-subtracted images. Background subtraction is performed on both the input images and the co-added images. The module is run twice. The first time (module Detect MedFilter), it is applied to the mosaic image, or the co-added tiles to subtract the background in preparation for point source detection. The second time (module Extract MedFilter), it is applied either to the input images (APEX Multiframe) or to the mosaic image (APEX Single Frame) for the purpose of subsequent point source fitting. The settings for Window X, Window Y, and Outliers / Window for the first run for detection should be more aggressive (smaller values) than for the fitting. There is also the option to use the faster Sbkg background fitting method, like that used by SExtractor.
Noise Estimation
There are two options available for noise estimation, set in the APEX Settings module. The default is to check the Use Data Uncertainties for PRF-fitted SNR option, which uses the data uncertainties to calculate the signal-to-noise ratio. The alternative is to leave the box unchecked, which will call the Gaussnoise module to estimate the background fluctuations in the images. It finds the 68-percentile range of the pixel values in a sliding window, which is defined to be the noise estimate. It can output the ratio of the input image to the noise, which is saved as a signal-to-noise ratio (SNR) image.
The results of noise estimation are output in the final extract table as the SNR.
Non-Linear Filtering
This step is performed to improve detectability of the point sources. The filtering is conceptually similar to a convolution of the input image by the PSF, which is commonly done during source extraction. It can be shown that using the ideas of maximizing SNR in the image that a filter can be derived to estimate the probability at each pixel of having a point source above the noise (see the document entitled "Bayesian Estimation of Point Source Probability" at the website).
The Point Source Probability module performs non-linear matched filtering and outputs point source probability (PSP) images. It is applied to the co-added images. This is an optional step.
Point Source Detection
A complex algorithm involving non-linear matched filtering and image segmentation has been developed. This algorithm is similar to that used by the SExtractor software. The purpose of filtering is to reduce fluctuations in the background noise and to enhance point source contributions. The design of the filtering is based on maximizing the SNR in the input images but APEX can also do detection on a number of types of images in addition to the filtered images.
Filtered images undergo a process of image segmentation. Contiguous clusters of pixels with values greater than a specified threshold are identified. The threshold is defined in terms of a robust estimate of the background fluctuations in the filtered, background-subtracted image. If the number of pixels in a cluster is smaller than a user specified threshold, the cluster is rejected. This is an additional guard against cosmic ray affected pixels and background noise fluctuations. If the number of pixels is greater than another user-specified threshold, the cluster is subject to further segmentation by progressively raising the threshold. This sub-segmentation process has several user-configurable parameters. The centroids of these final clusters are then calculated and stored in the detection list.
In APEX User List pipelines, this step is skipped in favor of using the user-input source list table.
Point Source Estimation
Final point source position and photometry estimation are performed at this stage for all point source candidates on the detection list. The position and flux of the point sources are fit simultaneously. Each detection comes with its own fitting area of a rectangular shape in the vicinity of the detection in each input image. The data in the fitting area are fit with the Point Response Function (PRF; see §8.7 and §8.6). In the multi-frame mode, the fitting is done simultaneously in all the input images containing the point source.
PRF fitting can be performed simultaneously for more than one point source. This process is called de-blending. The software is designed to perform two kinds of de-blending: passive and active. For passive de-blending the detected point sources, determined to be in a close proximity from one another so that their PRFs overlap, are fit simultaneously. The fitting areas are combined in this case. The classification of the detections as candidates for passive de-blending is done at the point source detection step. Passive deblending has been proven to be an essential component of point source extraction.
Active de-blending is a process that starts when a single point source is used to fit a single fitting area. The software can be configured to fit the same fitting area with more than one point source, if fitting with a single point source fails. Active de-blending is a very sensitive process and is currently under development.
In order to fit the data, a modified Simplex algorithm is employed. The Simplex algorithm does not use derivatives of the functions involved in minimization. This is a desirable feature since the transformation from local coordinates to global coordinates can be a very complicated function of its arguments.
In some cases, the PRF of a point source is not constant across all parts of the detector array. APEX allows users to use a variable PRF by creating and specifying a PRF map. The PRF map is a file that splits the array up into areas of constant PRF, so that a single PRF image can be used for sources that are detected within each area. A PRF map therefore identifies areas of constant PRF, and matches each area to an individual PRF file that should be used for point sources detected within that area.
The product of the Point Source Estimation stage is an extraction table that has over 20 columns, including point source positions in the sky and mosaic coordinates, fluxes, positional and flux uncertainties, SNR, etc.
Aperture Photometry
For each extracted point source, aperture photometry can be calculated. The user can specify an arbitrary number of aperture values. The results are appended to the output of the point source estimation. The aperture photometry is calculated using an exact algorithm to compute a fractional aperture-pixel overlap.
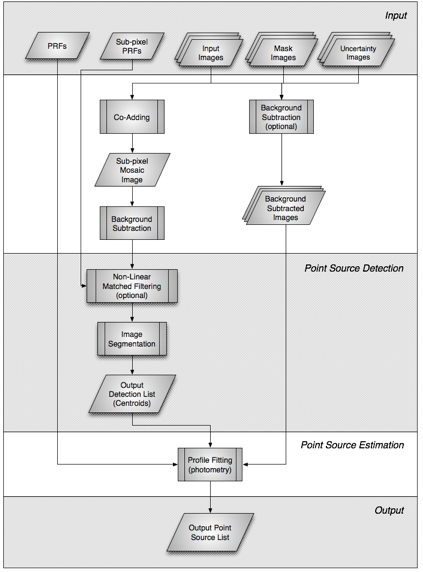
Figure 6.1 gives an overview of the APEX processing stages.
Figure 6.1: Overview of the main processing stages in APEX.