Open SPICE Generic Template: Create a new processing flow for a single BCD.
Open Batch SPICE Generic Template: Create a new batch processing flow.
Read SPICE User-Saved Template: Restore a processing flow from a previous saved template
Read Batch SPICE User-Saved Template: Restore a processing flow from a previous batch saved template
Save... Save processing flow to a known template file
Save As... Save processing flow to a new template file
Save Current Plotted Image as FITS file: This will allow you to save the currently plotted image as a FITS file. No overlay information is saved.
Save Current Plotted Image & Overlays to JPEG, GIF, BMP, or PNG: This will allow you to save the currently plotted image, along with the overlays, to a JPEG, GIF, BMP or PNG file.
3.2 Edit Menu
Undo [ctrl-Z]: Undo the last command
3.3 Process Menu
Run: run the entire processing flow.
Step: Run only one processing step.
Reset Run: reset all parameters
Pause Run: pause the processing at the current step. Allow for restart.
3.4 Tools Menu
Memory Monitor: This dialog shows how much memory (bytes) JAVA has allocated (total memory) and how much of that allocation is currently available (free memory). We are using this mainly as a debugging tool to determine when JAVA is having trouble with the memory allocation, mainly on Sun Workstations.
3.5 Images Menu
The Images menu allows you to load and display a FITS format sky image from a variety of different sources. The new image will be opened in a stand-alone FITS tab. The available image sources are:
2MASS: Two Micron All Sky Survey -- J, H, K images NOTE: These are compressed images, not the 2MASS Atlas images that contain all of the original scientific information. Use the 2MASS catalogs for detailed source information.
MSX: Galactic Plane Survey -- A, C, D, E images
DSS: Digital Sky Survey optical images
Sky View: The image collections from SkyView
NED: NASA/IPAC Extragalactic Database
FITS File: A local FITS image resident on your disk.
All Sky Images: The DIRBE 60 micron or ISSA all sky image can be displayed.
The first time you select an image to display that will be downloaded from a remote server, SPICE will ask you to specify a cache directory. SPICE caches the images so that if you want to display them again they are available locally from your disk. Select a directory where you can store large images.
3.6 Overlays Menu
The Overlays menu allows you to plot different overlays onto images that SPICE is displaying. These options are available only for FITS images that are opened in stand-alone FITS tabs. They are not available to overlay on IRS spectra BCDs. The available overlays are:
Catalogs from IPAC: From this dialog you can select catalogs to overlay onto your current target image. The currently available catalogs are the IRAS Point Source and Faint Source Catalogs, the 2MASS Point and Extended Source Catalogs and the NED Catalog. The dialog returns a list of targets in a circle of the radius you enter in degrees.
Catalogs from SkyView: From this dialog you can select from a list of catalogs from Skyview to overlay onto your current target image. The dialog returns a list of targets in a circle of the radius you enter in degrees.
Catalog File: Select a file in IPAC table format that resides on your local disk to overlay.
Crop: Crops the image using a mouse-selected box on the image.
Grid: From this dialog you select the type of grid to overlay onto the image display.
Distance Tool: This function measures the distance between 2 positions on an image. After selecting the distance tool, click with the left mouse button at the starting position (position 1) and then drag the mouse to the ending position (position 2). SPICE will report the distance in the selected units from position 1 to position 2. Click on the options button in the Distance Tool layer (the one with red horizontal lines) to see the various distances you have measured, change the units or colors, turn lines off/on, etc.
Slice Tool: Draw a line through the image by clicking the left mouse button and dragging the mouse along the desired segment. This will open a slice dialog, which will show the information about the end positions of the segment and an XY plot of flux vs. position along the segment. The plot can be zoomed, saved, and printed.
Area Statistics: Provides simple statistics of the pixels within a selectable area.
Mark object on Plot: Select this option to use the mouse to add marks to your current image. The type of mark and optional labels are user-selectable.
Current Fixed Target: Mark the position of the "current target" on the image. The current target is defined by the most recent search in the Images Menu, not by the target of the IRS BCD loaded for spectral extraction.
Generic Focal Plane: Draw a circle or square, of user-specified size, on the current image.
Spectrum: Overlay a spectrum from a table file on the output spectrum in the Plot window (see below). Choosing this option opens a dialog box to choose the overlay spectrum and to allow the following options:
Redshift of Target/Overlay: Enter the redshift of the target and the overlay spectra. The overlay will be shifted into the observed frame of the target spectrum and then overlaid;
Flux Normalization by Constant: The overlay spectrum can be normalized by a constant value entered here. All flux values in the overlay spectrum will be multiplied by this value;
Flux Normalization by Wavelength: The overlay spectrum can by normalized to ensure that its flux value at the chosen wavelength is equal to that of the target spectrum at the same wavelength.
The overlay spectrum will be shown as a dotted line. If order information is given in the input table, the orders will appear in varied color. Once opened, the overlay spectrum can be toggled to display or not using the check boxes in the plot window. NOTE: The overlay spectrum must be in IPAC table format. An example is given below.
Line List: Overlay a line list of labeled wavelengths from a table file on the output spectrum in the Plot window. The following options are available:
Remove Previous Line Lists: If checked, this option clears previous line lists;?
Redshift: The overlay wavelengths are assumed to be in the rest frame. They can be redshift to the target redshift entered here.
NOTE: The line list must be in IPAC table format. An example is given below.
DISCUSSION
The overlay capability within SPICE provides a flexible interface for choosing the extraction window and browsing the results.
IRS Focal Place Overlay: SPICE has the option to overlay the IRS slit position on a FITS Image. This option allows for easy interpretation of source positions either for the intended target or serendipitous sources that fall within the slit. When the IRS Focal Plane overlay is enabled, the position of the slit is drawn and control icons are added to the FITS image window. The FOV table icon opens a dialog box, which allows the user to choose which of the available slit overlays to enable.
In addition, the position on the Image can be matched to the position of the cursor within the 2D IRS dispersed image. Clicking on the IRS image within the slit will cause that position to be marked by a circle on the FITS image. If multiple images containing the slit position are open, the circle will be marked on all of them. Conversely, clicking within the slit on the FITS image will measure the percentage along the slit appropriate for input to the manual option of the RIDGE module. The percentage can be viewed by displaying the FOV table (the table icon in the box labelled "FOV" in the FITS image controls). It can be automatically entered into the RIDGE module by choosing "Apply". Note that this option is only available for the active order in low resolution; that is, if the Profile module has been run for the default, then only the default order is available for Ridge, and to choose the off-target order, Profile must be re-run.
For example, let�s assume that the current module flow is a Long-Low (channel 2) second-order spectrum of a known galaxy. The user, however, can see an unknown, faint continuum spectrum within the off-target first-order slit. To investigate further, the user can bring up a FITS image of the region of sky around the galaxy by using the Images menu. If a Spitzer image is available, it can be chosen from the "FITS Image File" option. Otherwise, SPICE can access standard sky surveys such as 2MASS. Using the IRS Focal Plane Overlay, the user can overplot both long-low slits on the image. Clicking on the unknown spectrum in the 2D IRS dispersed image will circle that position on the 2MASS image. To interactively examine the off-target order, the user needs to run Profile with first-order selected. Now, clicking on the 2MASS image within the first order slit will measure the Ridge percentage. So the user selects the "Manual" option in Ridge, and to see the percentage, the user opens the FOV table from the controls next to the 2MASS image. Clicking in the first order slit on the new object reveals that it is at 45% along the slit; clicking on "Apply" enters this automatically into Ridge. Now, running the rest of the current flow extracts the serendipitous object.
Spectrum Overlay: A spectrum used for overlay onto the output plot must be in IPAC table format. An example of a valid spectrum is:
|order |wavelength |flux |error |bit-flag |
|int |real |real |real |int |
| | |Jy |Jy | |
2 5.12652 0.000513 0.000026 12289
2 6.00354 0.044234 0.001196 0
2 7.03177 0.125992 0.001067 1
2 7.60636 0.303060 0.002753 0
3 7.33419 0.141934 0.001965 0
Line List Overlay: Input files for line list overlay must be in IPAC table format, containing a column for a label and two columns for wavelength. Wavelengths should be entered as a range, instead of a single value. The range will be shaded. An example of a valid line list is:
|label |lowerbound |upperbound |
|char |real |real |
| | | |
PAH 3.3 3.3
PAH 6.2 6.2
PAH 7.7 7.7
PAH 8.6 8.6
PAH 11.3 11.3
PAH 12.6 12.6
PAH 14.2 14.2
PAH 16.4 16.4
3.7 Options Menu
Use Automatic SPICE Version Update: The default for this is 'yes'. If an update for SPICE is available, when you start SPICE and connect to our server you will be asked if you would like to update your software.
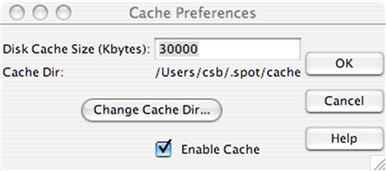
Cache Prefs: Spot caches to disk images that it retrieves from remote servers so that they are available locally the next time you ask Spot to display them. This saves time and network traffic. The first time you retrieve an image, Spot will ask you to designate a cache directory. You can change the location or size of the disk cache directory from this dialog.
Network Proxy Setup: This dialog allows you to set up a network proxy for SPICE access to the servers at the Spitzer Science Center.
Use Large Control Icons: Toggle the size of the control icons on the right of the FITS window.
Visualization: Show Mouse Help: You can remove the mouse control box when displaying images if you need more screen real estate.
Visualization: Show Side Bar on Current Frame / Show Side Bar on All Frames: These two options allow you to make the side bars, on the right of any image you are displaying, appear or disappear. This is useful if you are working on a very small screen and want to examine as much of the image as possible.
3.8 Help Menu
The Help menu provides access to the SPICE on-line help.
Overview: The on-line help directory is here.
About: The current version of SPICE you have installed