IRAS Explanatory Supplement
VII. Analysis of Processing
B. General Statistics of the Point Source Processing and Catalog
Table of Contents | Index | Previous Section | Next Section
B.1 The Generation of Reliable Point Sources
The complementary aims of completeness and reliability resulted in the design of detection and confirmation programs that acted as a series of filters to weed out spurious sources at each level of the data processing. Because the detection thresholds were set low to improve completeness, subsequent stages of confirmation were used to establish the reliability of the IRAS sources.
Approximately 500,000 events per day triggered the square-wave filter detection algorithm (Section V.C.2). Approximately 20 to 40% of these detections passed the signal-to-noise and correlation coefficient thresholds. The largest fraction of the detections that were accepted, about one-third of the total, came at 25 µm. Detections at 12 µm and 100 µm, each contributed one-quarter of the total number, while the remainder, about one-sixth of the total number, came at 60 µm. About two-thirds of the accepted detections were sightings at different wavelengths of approximately 25,000 seconds-confirmed band-merged sources produced only. About one-third of the seconds-confirmed sources were used in the roughly 4,000 hours-confirmed sources (hereafter denoted as HCONs) generated per day of surveying.
Hour-confirmed sources were placed into a Working Survey Data Base (WSDB) to await possible weeks-confirmation. At the completion of the initial data processing the WSDB contained about 1.2 million hours-confirmed sources spread over the entire sky. Of these, some 317,000 failed to be matched with a weeks-confirimng partner during the initial processing. The remaining 885,000 HCONs were combined by the weeks-confirmation processor during the normal processing into 319,000 distinct sources each consisting of two or more HCONs. The clean-up processing discussed Section V.H.2 forced close neighboring sources into single weeks-confirmed sources, decreasing the number of distinct objects while increasing the average number of HCONs per source. After clean-up there were about 304,000 single HCONs and 314,000 weeks-confirmed sources, each consisting of two or more HCONs. The breakdown of the catalog by numbers of HCONs is given in Table VII.B.1.
There were three reasons why even a weeks-confirmed source could be excluded from the catalog. first, the source could fail to satisfy the criteria of having at least one high quality flux in one band or two or more moderate quality fluxes in adjacent bands (Section on V.H.5); some 12,000 sources were rejected for this reason. Second, the high source density processing could eliminate a source due to the strict selection rules imposed in such areas (Sections V.H.6 and VII.E.1.b); about 57,000 sources which had all survived the first test were rejected by these criteria. Third a source could be deleted because it was a spurious object produced near a bright source (Section VII.E.4); there were 22 such sources outside of the Galactic plane. Of the 314,000 weeks-confirmed sources in the WSDB, 245,839 survived all these criteria to appear in the catalog.
B.2 Distribution of Sources in the Catalog
 |
|
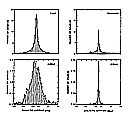
Figure VII.B.1 The number density (per sq. deg) of four kinds of IRAS
source (see text) is shown as a function of Galactic latitude, averaged
over all Galactic longitudes. larger largest |
As mentioned in Section I.C, there is a meaningful astrophysical classification for almost all of the IRAS sources. Objects detected at 12 µm and having fv(12 µm) > fv(25 µm) are typically stars (Fig. I.C.2, type S in Table VII.B.2). Objects detected at 60 µm and having fv(60 µm) > fv(25 µm) are either galaxies if they are located away from the Galactic plane or warm Galactic objects if located near the plane (type C, Fig. I.C.3). Objects detected only at 100 µm are predominantly cirrus sources, although some at very high Galactic latitudes may be external galaxies (type C, Fig. I.C.4). Sources meeting none of these criteria are classified "other" and lie mostly in the Galactic plane. Figure VII.B.1 shows histograms of the distribution of the four types of sources as a function of Galactic latitude.
All cataloged sources can also be classified into 15 different spectral
groups depending on which bands have measurements of either moderate or
high quality. The numbers in each category are given in
Table
VII.B.2, where a code has been used to specify which bands were reliably
detected. If the presence or absence of a measured flux density at 12,
25, 60 and 100 µm is considered in that order to correspond
to a "1" or "0" in a four digit number, then a source
measured only at 12 µm is denoted by "1000", while
one measured at 12 µm and 60 µm is denoted by "1010",
etc. The distribution on the sky of each of these color combinations is
shown in a series of equal area projections in Galactic coordinates. These
figures are shown in an appendix at the end of the chapter
(Figs. VII.Ap.1-15).
Table of Contents | Index | Previous Section | Next Section