Relevant Pipelines: APEX Single Frame; APEX Multiframe
PURPOSE
This module determines a fitting area for each source in the detect table. If not run, the fitting will be done for each detection using the fixed value of Fitting Area X,Y defined in the Source Estimatemodule. The term "Fit Radius" is a little misleading, since all fitting is done in a box, not a circle.
INPUT
None.
COMMAND LINE INPUT
&FIT_RADIUS
&END
OUTPUT
The fitting area size Fit X,Y in pixels is written into the existing detect table (*_detect.tbl).
DISCUSSION
Running of this module is optional, but it should generally be run for point sources with good signal-to-noise. Another option is to specify the fitting area size in the Source Estimate module using the parameters Fitting Area X and Fitting Area Y. However in this case the same fitting area size is used for all point sources. If both set of parameters Fitting Area X, Fitting Area Y and columns FitX, FitY in the detect table are given as input for point source fitting, the former are used.
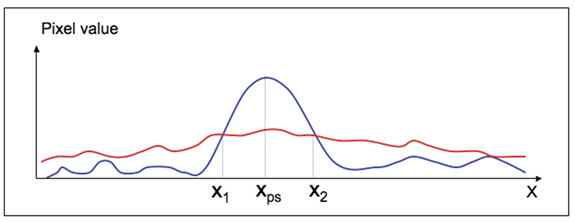
The Fit Radius module reads in a detection list with two required fields "x" and "y". It reads the image corresponding to the detection list and the uncertainty image. The input image is mean-subtracted. The module also optionally reads a coverage map. If a coverage map is given, then the uncertainty values are multiplied by sqrt(coverage). For each detection, a search is performed in the x and y directions. The program starts at the detection pixel and goes up and down in the y-direction and left and right in the x-direction. It compares the values of the mean-subtracted input image and the corresponding uncertainty values. It finds the closer distance one has to go in each direction until the mean-subtracted image pixel values drop below the uncertainty level.
Figure 6.2: The mean-subtracted input image (blue) and the uncertainty image (red) have two intersection points x1 and x2. xps is the position of the detection. In this case, the fitting size FitX = 2(x2 - xps), since (x2-xps) < (xps - x1).
All the content of the input table is copied into the output table. Two more columns FitX and FitY are added: