This tool provides access to data sets from the Two Micron All Sky Survey (2MASS), the Wide-field Infrared Explorer (WISE) AllWISE all-sky survey, the InfraRed Astronomy Satellite (IRAS) all-sky survey, AKARI Far Infrared Surveyor (FIS), the Digitized Sky Surveys (DSS) (both First and Second Generation), and the Sloan Digital Sky Survey (SDSS). Please note that the DSS and SDSS data do not reside at IRSA, so the successful retrieval of DSS and SDSS data depends on the operation of the DSS and SDSS services, located at other institutions.
Besides this online help (also available as a PDF), there are also
Finder Chart video tutorials, available at the IRSA YouTube channel ![]() . There is a playlist that collects together all of
the Finder Chart videos. Also see the list of "micro-tutorials"
relevant for more than one tool, and the list of tutorials using more
than one tool.
. There is a playlist that collects together all of
the Finder Chart videos. Also see the list of "micro-tutorials"
relevant for more than one tool, and the list of tutorials using more
than one tool.
This service makes use of components of Montage, funded by the National Aeronautics and Space Administration's Earth Science Technology Office, Computational Technologies Project, under Cooperative Agreement Number NCC5-626 between NASA and the California Institute of Technology.
Contents of page/chapter:
+Surveys, Wavelengths, and Sky Coverage
+Terminology
+Side Menu and Adding to the Tabs Menu
+Side Menu and Appearance
+User Login Overview
+Getting More Help
| image | band | approx. wavelength range |
| DSS1B | Bj | 3950 - 5400 Angstroms |
| DSS1R | R | 6125 - 6475 Angstroms |
| DSS2B | Bj | 3950 - 5400 Angstroms |
| DSS2R | R | 6300 - 6900 Angstroms |
| DSS2IR | I | 6950 - 9000 Angstroms |
| Band | Approximate central wavelength |
| u | 2910 Angstroms |
| g | 4810 Angstroms |
| r | 6230 Angstroms |
| i | 7640 Angstroms |
| z | 9060 Angstroms |
| Band | Approximate central wavelength |
| J | 1.235 microns |
| H | 1.662 microns |
| Ks | 2.159 microns |
| Band | Approximate central wavelength |
| W1 | 3.4 microns |
| W2 | 4.6 microns |
| W3 | 12 microns |
| W4 | 22 microns |
| Band | Approximate central wavelength |
| IRAC-1 | 3.6 microns |
| IRAC-2 | 4.5 microns |
| IRAC-3 | 5.8 microns |
| IRAC-4 | 8 microns |
| MIPS-1 | 24 microns |
| Band | Approximate central wavelength |
| N60, or flux65 | 60 microns |
| WIDE-S, or flux90 | 90 microns |
| WIDE-L, or flux140 | 140 microns |
| N160, or flux160 | 160 microns |
| Band | Approximate central wavelength |
| IRAS-1 | 12 microns |
| IRAS-2 | 25 microns |
| IRAS-3 | 60 microns |
| IRAS-4 | 100 microns |

This icon in the upper left  pulls open a
"drawer" from the left hand side which enables you to add or remove tabs from this top level (see below). It also can allow you to change the appearance (dark or light mode) (see below).
pulls open a
"drawer" from the left hand side which enables you to add or remove tabs from this top level (see below). It also can allow you to change the appearance (dark or light mode) (see below).
When you have results loaded into Finder
Chart, your browser window is divided into "panes",
like "window panes." The contents of the panes depends on what you are
doing with the tool, but could include an image pane, at least one
table pane, and/or a plot pane. You can expand any of the window
panes by clicking on the expand icon: 
Each of the three main kinds of 'panes' in the display has its own toolbox in its upper right corner which operates on things in that pane, and the basic functionality for each of these panes is covered elsewhere in this document:
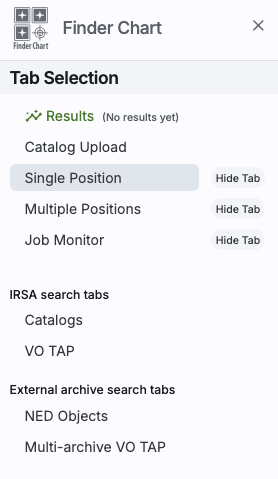
in the upper left pulls open a
"drawer" from the left hand side; the top of it looks like this:
|
The highlighted bar ("Results" in this example) is the tab you have in
the foreground on your main window. You can use this side menu to add (or remove) blue tabs from the top of your Finder Chart interface. By default, Results, Single Position (a searching option), and Multiple Position (another searching option) are shown, along with the Job Monitor. Under "IRSA search tabs," Catalogs and VO TAP search IRSA holdings. Under "External archive search tabs," NED Objects and Multi-archive VO TAP (that is, a general TAP search) search other (non-IRSA) archives. Click on the "Hide Tab" button to remove that corresponding tab.
|
in the upper left pulls open a
"drawer" from the left hand side; the bottom of it looks like
this: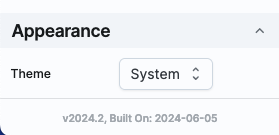
This controls the appearance of the tool in your browser -- do you want it to run as light mode, dark mode, or respect whatever preferences you have set on your system? Try out the different modes; you may have a preference!
 leads you into this
online help. There are also context-sensitive help markers throughout
the tools (
leads you into this
online help. There are also context-sensitive help markers throughout
the tools ( ). You can also download a PDF
version of this manual; look at the top left of the help window. (The
PDF may be easier to search than the web pages; use your PDF reader's
search function.)
). You can also download a PDF
version of this manual; look at the top left of the help window. (The
PDF may be easier to search than the web pages; use your PDF reader's
search function.)
You can submit questions to the IRSA Help Desk ![]() .
.
A set of frequently asked questions (FAQs) about Finder Chart is here.
The IRSA YouTube channel ![]() has lots of short videos about IRSA tools.
has lots of short videos about IRSA tools.
Found a bug? The known bugs and
issues in this version of the Finder Chart are listed here ![]() . If
you think you have found a bug, before reporting it, please check this
list, and read this online Finder Chart help. It may be a "feature" we
already know about. If you have found a new, real bug, then please do
contact us via the IRSA Help Desk
. If
you think you have found a bug, before reporting it, please check this
list, and read this online Finder Chart help. It may be a "feature" we
already know about. If you have found a new, real bug, then please do
contact us via the IRSA Help Desk ![]() . Please include your operating system version and
your browser software and version. If you can, please also include
any specific error message you may have gotten. (NB: In our testing,
copying shortcuts worked on Windows and Linux; the command-C did not
always work on Macs, but selecting and clicking the right mouse button
often did when command-C did not.)
. Please include your operating system version and
your browser software and version. If you can, please also include
any specific error message you may have gotten. (NB: In our testing,
copying shortcuts worked on Windows and Linux; the command-C did not
always work on Macs, but selecting and clicking the right mouse button
often did when command-C did not.)