Scientific Observations Gallery
| Title | Image |
|---|---|
|
D/H ratio in cometary water as a function of the active fraction
Caption
The D/H ratio in cometary water as a function of the active fraction. The blue horizontal line corresponds to the Earth’s ocean value. The dashed-dotted line shows the expected ratio assuming two sources of water: D-rich (3.5×terrestrial) from the nucleus and terrestrial.
Credits
Lis et al.
|

|
|
First Astrophysical Detection of a Very Special Molecule
Caption
Image of planetary nebula NGC 7027 with illustration of helium hydride molecules. In this planetary nebula, SOFIA detected helium hydride, a combination of helium (red) and hydrogen (blue), which was the first type of molecule to ever form in the early universe. This is the first time helium hydride has been found in the modern universe.
Credits
NASA/ESA/Hubble Processing: Judy Schmidt
|

|
|
The Cosmic Fireworks of Massive Star Formation
Caption
A cosmic light show sparked by the formation of massive stars in the W51 stellar nursery. The SOFIA FORCAST mosaic (color) is superposed on a star field (white) from the Sloan Digital Sky Survey. Massive stars like these emit so much energy that they play a critical role in the evolution of our galaxy.
Credits
NASA/SOFIA/Lim and De Buizer et al. and Sloan Digital Sky Survey
|

|
|
Cigar Galaxy (M82)
Caption
Composite image of the Cigar Galaxy (also called M82), a starburst galaxy about 12 million light-years away in the constellation Ursa Major. The magnetic field detected by SOFIA, shown as streamlines, appears to follow the bipolar outflows (red) generated by the intense nuclear starburst. The image combines visible starlight (gray) and a tracing of hydrogen gas (red) from the Kitt Peak Observatory, with near-infrared and mid-infrared starlight and dust (yellow) from SOFIA and the Spitzer Space Telescope.
Credits
NASA/SOFIA/E. Lopez-Rodriguez; NASA/Spitzer/J. Moustakas et al.
|

|
|
Magnetic Fields in the Orion Nebula
Caption
Magnetic fields in the Orion Nebula, shown as stream lines over an infrared image taken by the Very Large Telescope in Chile, are regulating the formation of new stars. SOFIA’s HAWC+ instrument is sensitive to the alignment of dust grains, which line up along magnetic fields, letting researchers infer the direction and strength.
Credits
NASA/SOFIA/D. Chuss et al. and European Southern Observatory/M.McCaughrean et al.
|

|
|
Supernova 1987A
Caption
Artist's concept illustrating Supernova 1987A as the powerful blast wave passes through its outer ring and destroys most of its dust, before the dust re-forms or grows rapidly. SOFIA observations reveal that this dust — a building block of stars and planets — can re-form or grow immediately after the catastrophic damage caused by the supernova’s blast wave.
Credits
NASA/SOFIA/Symbolic Pictures/The Casadonte Group
|

|
|
Massive Star Formation in Orion
Caption
Three infrared views of the Orion region of massive star formationtaken with the Herschel Space Observatory, the Stratospheric Observatory for Infrared Astronomy (SOFIA), and the Spitzer Space Telescope, reveal very similar morphology with different tracers of the dust and gas in the molecular cloud. The dust continuum view as observed by the Herschel Space Observatory in far-infrared (blue; PACS) and sub-millimeter (red; SPIRE) emission, measuring the conversion of FUV radiation from massive stars to dust emission in the photodissociation region (PDR). The integrated [CII] 1.9 THz (158 μm) emission as observed by the upGREAT instrument on board SOFIA, tracing cooling and kinematics of PDR gas. c) The 8 μm PAH emission observed by the IRAC instrument on board of the Spitzer Space Telescope, outlining the FUV illuminated PDR surfaces.
Credits
Herschel Image credit: ESA/Herschel/Ph. André
SOFIA image credit: NASA/SOFIA/Cornelia Pabst & the C+SQUAD Spitzer Image credit: NASA/JPL Caltech/Tom Megeath |

|
|
Orion Nebula Bubble
Caption
The powerful wind from the newly formed star at the heart of the Orion Nebula is creating the bubble (black) and preventing new stars from forming in its neighborhood. At the same time, the wind is pushing molecular gas (color) to the edges, creating a dense shell around the bubble where future generations of stars can form.
Credits
NASA/SOFIA/Pabst et. al
|

|
|
Orion's Dragon
Caption
Far infrared imaging spectroscopy of the Orion nebula from SOFIA/upGREAT. Over two million [C II] 158 μm spectra create a 3D data cube of Right Ascension, Declination, and line-of-site velocity. As the cube rotates around the vertical axis, the dragon figure is revealed as the rotation approaches 180 degrees.
Credits
NASA/SOFIA/upGREAT
|

|
|
Cloud Collision
Caption
Artist’s impression of a star cluster forming from the collision of turbulent molecular clouds, which appear as dark shadows in front of the background galactic star field. The molecular clouds are surrounded by atomic envelopes, here illustrated in green, which have been detected via emission from ionized carbon by SOFIA. The spatial offset and motions of these envelopes confirm predictions of simulations of cloud collisions.
Credits
NASA/SOFIA/Lynette Cook
|

|
|
Cygnus A
Caption
Artist’s conception of Cygnus A, surrounded by the torus of dust and debris with jets launching from its center. Magnetic fields are illustrated trapping dust near the supermassive black hole at the galaxy’s core.
Credits
NASA/SOFIA/Lynette Cook
|

|
|
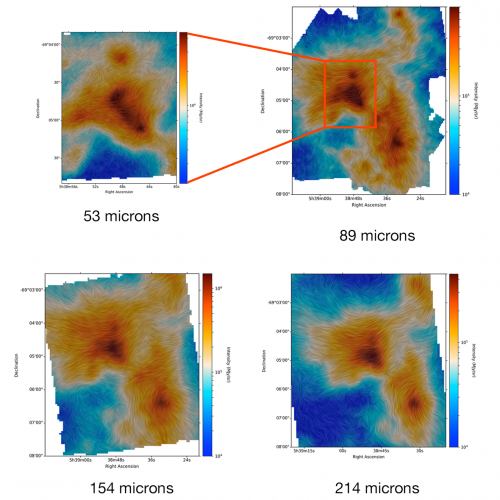
30 Doradus
Caption
Images taken at multiple wavelengths showing the dust and the magnetic fields in 30 Doradus. The color scale shows the intensity of the infrared radiation from the dust, or dust emission, and the lines show the morphology, or the structure, of the magnetic fields. The images taken at the shorter wavelengths (53- 89 microns), reveal warmer dust, while the images taken at the longer wavelengths (114-213 microns) show cooler dust.
Credits
NASA/SOFIA
|
|
|
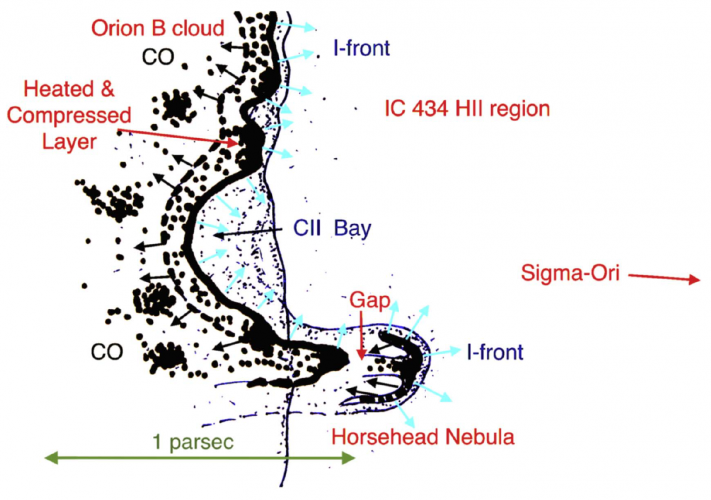
Horsehead Nebula and the IC 434 I-front
Caption
Illustration showing the likely configuration of the Horsehead Nebula and the IC 434 I-front. Our line of sight is from below and in front of the figure. σ Ori is located about 4 pc to the right and slightly behind the plane of the sky from our vantage point. The thin solid line shows the I-front, with cyan vectors indicating the approximate direction of the ionized photoablation flow. The thick solid line shows the approximate location where CO is dissociated into C I and O I. Most [C II] emission is located between this line and the I-front. The thick dashed line indicates the likely location of the D-type shock or compression wave pushed into the Orion B cloud on the left. The black dotted regions are meant to indicate preexisting dense clumps in the cloud and the compressed layer between the advancing H II region driven D-type shock or compression wave.
Credits
NASA/SOFIA/J. Bally et. al
|
|
|
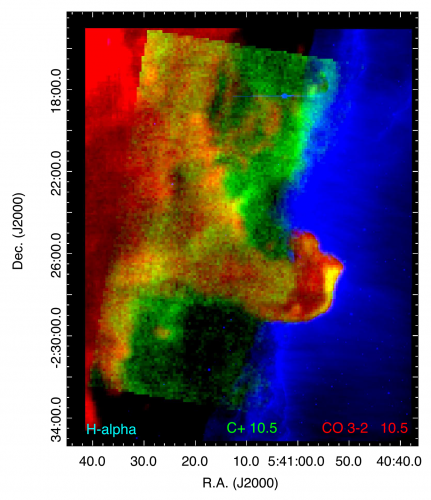
Horsehead Nebula
Caption
Horsehead Nebula in Hα (blue), C+ (green) in ΔV = 0.96 km s-1 channels, and CO 3–2 (red) in ΔV = 0.25 km s-1 channels. The LSR velocities in km s-1 are indicated in the corresponding green and red numbers.
Credits
NASA/SOFIA/J. Bally et. al
|
|
|
C2013 US10 Catalina Coma
Caption
FPI+ produced an Ι-band image of Comet C2013 US10 Catalina as part of a combined infrared and visual observation. The comet’s coma is nicely visible in comparison to the more compact stars toward the bottom of the image.
Credits
(C.E. Woodward et al.)
|

|
|
Orion Nebula: [OI] 146 μm
Caption
The Orion Nebula was mapped by FIFI-LS at 146 μm to study the physical conditions of its atomic and molecular gas. The far infrared continuum (logarithmic scale) is shown peaking at the Becklin-Neugebauer object, but also clearly shows the Orion Bar and a similar structure to the north-east (left). Additionally, the [OI] line emission tracing the photon-dominated regions around the Trapezium stars where the star’s UV radiation irradiates the surrounding molecular cloud (right).
Credits
SOFIA/FIFI-LS Team
|
![Orion Nebula: [OI] 146 μm](/data/SOFIA/docs/sites/default/files/styles/lightboxgallery_height_500/public/Public/SCI2018_0005.png "Orion Nebula: [OI] 146 μm")
|
|
New SOFIA Observations Help Unravel Mysteries of the Birth of Colossal Suns
Caption
The massive forming star Cepheus A shown at three infrared wavelengths of 8, 19 and 37 microns. The location of the star is marked by the green dot in each panel. As the wavelength increases, researchers can see more deeply into the dusty gas cloud from which the star is forming. Light from the outflow cavity facing toward the telescope is indicated with the blue arrows, while light from the cavity facing away from the telescope is indicated with the red arrows. As part of the formation process, a disk around the star launches magnetized winds that clear a path through the dense, dusty cloud, making it easier to see the hot, glowing dust near star. The 8 micron image only reveals light from the outflow cavity facing the telescope. But in the 37 micron image, the longest wavelength, the hot dust from both cavities becomes apparent. By using the images at various wavelengths, researchers can reconstruct the structure and orientation of the material forming Cepheus A.
Credits
NASA/SOFIA/J. De Buizer/J. Tan
|

|
|
HAWC+/SOFIA Observations of Rho Oph A: Far-Infrared Polarization Spectrum
Caption
Left: NASA Spitzer image showing the portion of the Rho Oph dark cloud observed with HAWC+ instrument. Right: HAWC+ image showing systematic variations of the far-infrared polarization spectrum in the interstellar cloud Rho Ophiuchi.
Credits
Left: NASA/JPL-Caltech/Harvard-Smithsonian CfA; Right: SOFIA/HAWC+/Northwestern University/F. Pereira Santos
|

|
|
A Far-Infrared View of Active Galactic Nuclei with SOFIA/HAWC+
Caption
The left image shows the large-scale magnetic field along the polar direction of the disk of the starburst galaxy M82. The HAWC+ imaging polarimetric observations show, for the first time, a relatively hot dust magnetically aligned along the direction of the outflows. The right image shows a multi-wavelength view of the galaxy, with the blue x-ray revealing gas that has been heated by the violent outflow.
Credits
Left: SOFIA/HAWC+/E. Lopez-Rodriguez; Right: X-ray: NASA/CXC/JHU/D.Strickland; Optical: NASA/ESA/STScI/AURA/The Hubble Heritage Team; IR: NASA/JPL-Caltech/Univ. of AZ/C. Engelbracht
|

|
|
A Far-Infrared View of Active Galactic Nuclei with SOFIA/HAWC+
Caption
The HAWC+ image of NGC 1068 shows, for the first time, the magnetized spiral arms of the host galaxy. The forces exerted by the magnetic fields are dominated by rotation of the disk, making the dust grains to be aligned along the spiral arms as they are clearly detected by these HAWC+ polarimetric observations at 53 µm.
Credits
SOFIA/HAWC+/E. Lopez-Rodriguez
|

|
|
Does New Horizons’ Next Target Have a Moon?
Caption
Data obtained by SOFIA in July 2017 when Kuiper Belt Object 2014 MU69 passed in front of a distant star suggests that a moon may orbit the New Horizons spacecraft's next fly-by target. New Horizons will encounter 2014 MU69 on New Year's Day 2019.
Credits
NASA/JHUAPL/SwRI
|

|
|
Orion Polarimetry
Caption
The HAWC+ Instrument performed polarization measurements at 89 μm to capture the structure of the magnetic field in the Orion star forming region. Each line segment represents the orientation of the magnetic field at that location, overlaid on an image of the total intensity at the same wavelength. The total intensity image has a pixel scale of 1.5 arcsec per pixel and the polarization results were smoothed to a scale of 8 arcsec per pixel to produce statistically independent vectors in this HAWC+ observing band. For clarity, the line segments are set to a fixed length.
Credits
(NASA/SOFIA/Caltech/Darren Dowell)
|

|
|
Observations of a Comet’s First Passage through the Solar System Reveals Unexpected Secrets
Caption
Artist’s depiction of Comet C/2012 K1 (also called Pan-STARRS) and its coma during its first approach into the solar system.
Credits
(NASA/SOFIA/ Lynette Cook)
|

|
|
SOFIA Finds Cool Dust Around Energetic Active Black Holes
Caption
Artist illustration of the thick ring of dust that can obscure the energetic processes that occur near the supermassive black hole of an active galactic nuclei. The SOFIA studies suggest that the dust distribution is about 30 percent smaller than previously thought.
Credits
(NASA/SOFIA/Lynette Cook)
|

|
|
Understanding Star Formation in the Nucleus of Galaxy IC 342
Caption
Figure 1: A near- and mid-infrared image of galaxy IC 342 from the Spitzer Space Telescope. The region studied by SOFIA/GREAT is the centermost zone, shown inside the yellow box, appearing white and purple in this false-color representation.
Credits
(Röllig, et. al.)
|

|
|
[C II] 158 μm and [N II] 205 μm emission from IC 342
Caption
Line-integrated map of the 12 CO(1-0) transition from the BIMA-SONG sample. The yellow points show the observed GREAT positions in IC 342. The (0, 0) position corresponds to (RA, Dec) (J2000) (03:46:48.5 68:05:47). The red points indicate named GMCs and other structures according to Table 3 in Meier & Turner (2001). Triangles facing up and right indicate HII regions and super nova remnants, respectively, as given by Tsai et al. (2006). The [C II] and [N II] spectra are shown on the right side. The [N II] intensity scale is multiplied by a factor of 5.
Credits
(Röllig et al.)
|
 transition from the BIMA-SONG sample")
|
|
SOFIA Confirms Nearby Planetary System is Similar to Our Own
Caption
Artist's illustration of the Epsilon Eridani system showing Epsilon Eridani b, right foreground, a Jupiter-mass planet orbiting its parent star at the outside edge of an asteroid belt. In the background can be seen another narrow asteroid or comet belt plus an outermost belt similar in size to our solar system's Kuiper Belt. The similarity of the structure of the Epsilon Eridani system to our solar system is remarkable, although Epsilon Eridani is much younger than our sun. SOFIA observations confirmed the existence of the asteroid belt adjacent to the orbit of the Jovian planet.
Credits
NASA/SOFIA/Lynette Cook
|

|
|
Supernova Remnant G54.1+0.3
Caption
Image of the supernova remnant G54.1+0.3 combining X-rays from Chandra (blue), infrared PAH emission (green) and small dust grains (red) from Spitzer. The X-rays from the center of the supernova remnant arise from a pulsar wind nebula. The infrared emission from the supernova remnant arises from swept-up interstellarmaterial and freshly-formed dust. Some of the stars are engulfed by supernova dust; those stars are surrounded by a yellow glow from the grains which are heated by the stars as they pass close by. The white graph shows the infrared spectral energy distribution of the shell, together with a model of emission from silicates and corundum (see Temim et al.; 2017 ApJ 836, 129).
Credits
Image: NASA/Chandra X-Ray Observatory and Spitzer Space Telescope; Graph: Tea Temim
|

|
|
Don’t Judge an Asteroid by its Cover: Mid-infrared Data from SOFIA Shows Ceres’ True Composition
Caption
The column of material at and just below the surface of dwarf planet Ceres (box) – the top layer contains anhydrous (dry) pyroxene dust accumulated from space mixed in with native hydrous (wet) dust, carbonates, and water ice. (Bottom) Cross section of Ceres showing the surface layers that are the subject of this study plus a watery mantle and a rocky-metallic core.
Credits
Pierre Vernazza, LAM–CNRS/AMU
|

|
|
NASA Flying Observatory Makes Observations of Jupiter Previously Only Possible from Space
Caption
Jupiter was observed with SOFIA by stepping the FORCAST spectroscopic slit across the planet. The left-hand panel shows a visible-light image of Jupiter with blue rectangles illustrating the orientation and size of the FORCAST slit. For each pointing of the telescope, the spectrum was made at every position along the slit. The two right-hand panels show SOFIA images of Jupiter made from combining the wavelengths in two of the slits. Jupiter's Great Red Spot is evident and has rotated between the different observations. The total information content is full images of Jupiter at all wavelengths between 17.9 and 32.9 microns, or equivalently, spectra at each position.
Credits
Visible light image: Anthony Wesley. FORCAST slitscan: NASA/SOFIA/Fletcher et al.
|

|