Scientific Observations Gallery
| Title | Image |
|---|---|
|
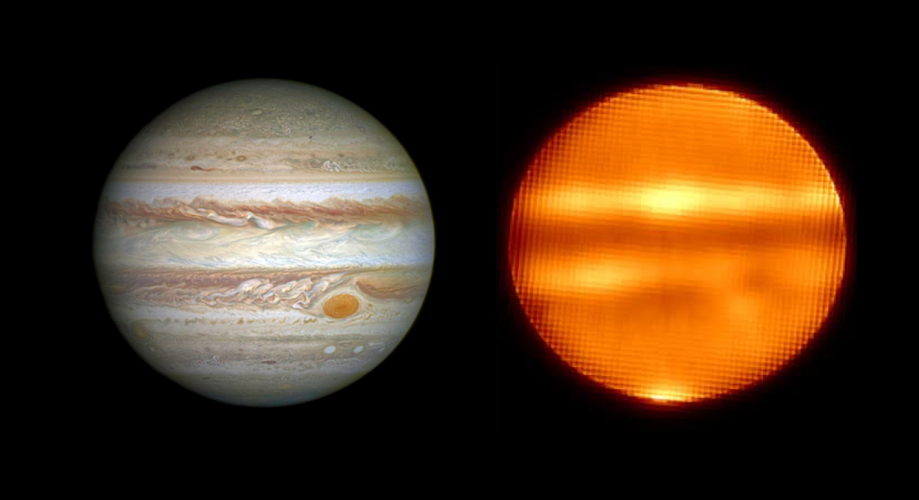
Optical and Infrared Jupiter
Caption
Left: Optical image of Jupiter taken by the Hubble Space Telescope. Right: SOFIA image of Jupiter demonstrating the variation in its brightness temperature with latitude. The two images show Jupiter in approximately the same orientation.
Credits
Left: NASA/ESA; Right: NASA/SOFIA/de Pater et al., 2021
|
|
|
Averaged spectrum of SOFIA/GREAT [CII] data
Caption
Averaged spectrum of the SOFIA/GREAT [CII] data (blue), with the ancillary CO (red) and HI (yellow) spectra. We decomposed the [CII] profile by fitting a combination of the CO and HI spectra shown in black, revealing that the [CII] originates from the molecular and atomic gas about equally.
Credits
Tarantino et al. 2021
|
![Averaged spectrum of the SOFIA/GREAT [CII] data (blue), with the ancillary CO (red) and HI (yellow) spectra.](/data/SOFIA/docs/sites/default/files/styles/lightboxgallery_height_500/public/2022-04/SCI2022_0005.png)
|
|
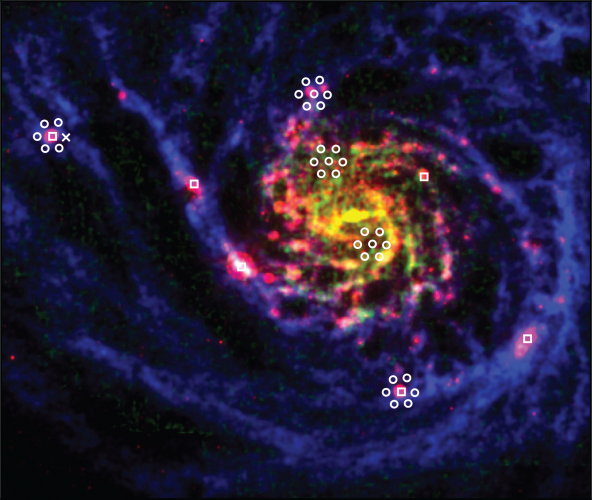
Multi-Phase [CII] Emission in Nearby Galaxies
Caption
Image of M101 showing the 24 μm Spitzer emission from warm dust (red), the CO (2-1) emission from molecular gas (green), and the 21-cm HI emission that traces the atomic gas (blue). The pointings from SOFIA/GREAT are shown as white circles and squares, designating areas of high and low star formation, respectively. Pointing selection shows a range of environments, probing the metallicity gradient in each galaxy and different levels of star formation rate.
Credits
Kennicutt et al. 2003 (SINGS survey from Spitzer/MIPS), Leroy et al. 2009 (HERACLES survey from IRAM 30-m), and Walter et al. 2008 (THINGS survey from VLA)
|
|
|
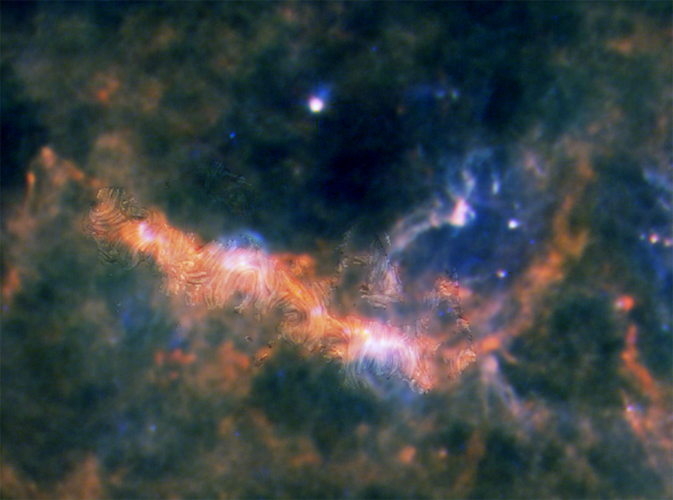
G47 with Magnetic Streamlines
Caption
A map shows the direction of magnetic fields in the G47 bone overlain atop an image of the G47 filament as seen by the Herschel Space Observatory. The red and yellow areas are high-density regions of dust and gas.
Credits
G47: ESA/Herschel/PACS/SPIRE/Ke Wang et al. 2015; Polarization map: Stephens et al., 2022
|
|
|
Magnetically-Driven Flows in NGC 1097
Caption
Magnetic field streamlines from the Effelsberg radio telescope superposed on an image of the central 1 kpc starburst ring of the spiral galaxy NGC 1097 obtained with the NACO adaptive optics on the VLT. Gas streams follow the magnetic field, feeding the super massive black hole with matter from the galaxy. The image was constructed by stacking J- (blue), H- (green), and Ks-band (red) images.
Credits
NASA, the SOFIA science team, E. Lopez-Rodriguez et al.; ESO/Prieto et al.
|
|
|
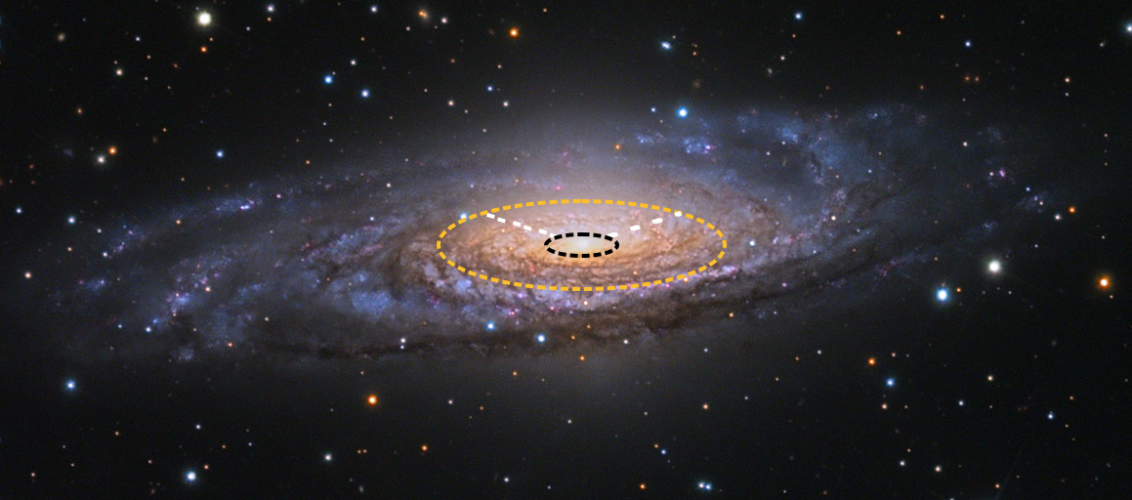
Ionized Carbon Emission in NGC 7331
Caption
Because NGC 7331 is viewed at an incline, there is a marked difference in the ionized carbon emission observed in different parts of the galaxy, depending on our observing perspective. Emission from within the delineated donut shape varies between the side of the galaxy that is closer to us (lower sector) and its far side (upper sector). This shows that viewing perspective has an effect on the origin of the ionized carbon emission observed.
Credits
Adam Block/Mount Lemmon SkyCenter/University of Arizona/Sutter et al., 2022
|
|
|
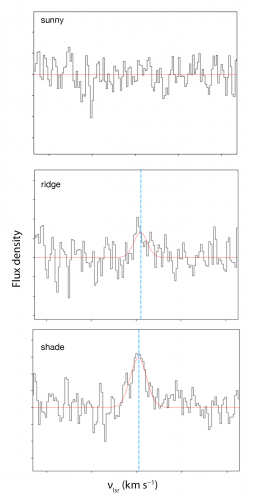
Ghost Nebula H2 Emission Line Profiles
Caption
The H 2 emission line profiles for the sunny , ridge , and shady regions of the Ghost Nebula. No emission is detected in the sunny side of the PDR, showing the sharp photo-dissociation transition caused by the efficient self-shielding in H 2 . The dashed blue line shows the center of the detected emission line and the solid red line shows the Gaussian fit.
Credits
Soam et al. 2021
|
|
|
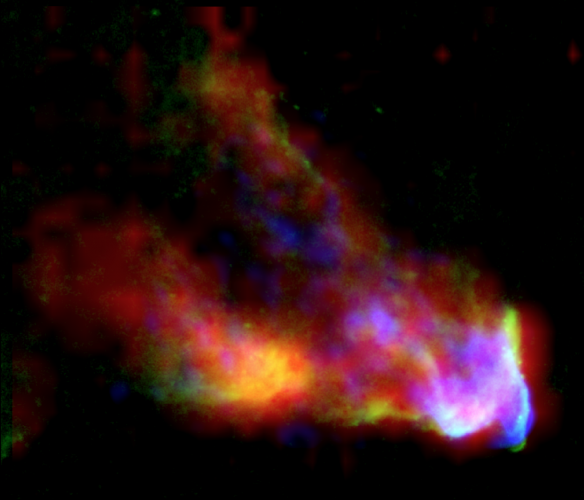
Temperature and Density Layers in the Ghost Nebula
Caption
Three-color image of the Ghost Nebula with C + emission from SOFIA/upGREAT (red), molecular hydrogen fluorescence from the Canada-France-Hawaii Telescope (green), and HCO + gas emission from CARMA (blue). The ridge described in the text is the green-white vertical structure in the lower right corner.
Credits
Soam et al. 2021
|
|
|
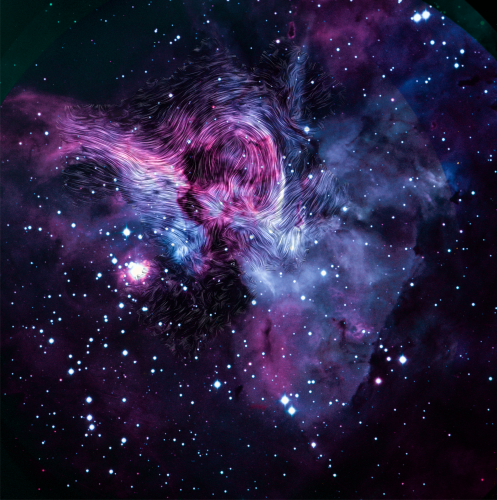
Role of Magnetic Fields in Cloud Destruction in the Keyhole Nebula
Caption
Magnetic field streamlines detected by SOFIA are shown over an image of the Keyhole Nebula, part of the larger Carina Nebula, imaged with the ESO 3.6-metre telescope on La Silla.
Credits
NASA, the SOFIA science team, Y. Seo; ESO
|
|
|
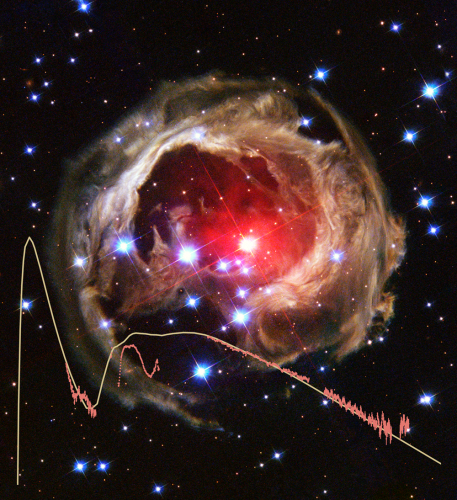
V838 Mon with Spectra
Caption
SOFIA FORCAST measurements (orange) of the V838 Mon spectrum, and the best-fit composite model of SOFIA data with a silicate-to-alumina ratio of 50:50 (yellow), overlaid atop an image of V838 Mon obtained by the Hubble Space Telescope, which shows the light echo illuminating circumstellar material.
Credits
V838 Mon: ESA/Hubble & NASA; Spectra: Woodward et al.
|
|
|
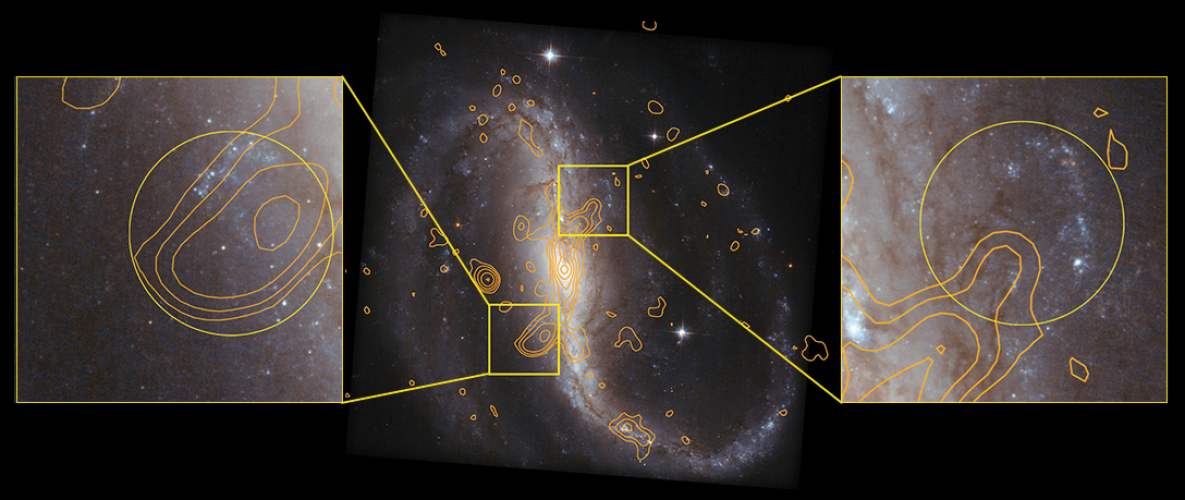
Evidence of [CII] Shocked Emission in NGC 7479
Caption
The Hubble Space Telescope image of NGC 7479 created from observations at visible and near-infrared wavelengths with 20 cm radio continuum contours in yellow (middle panel). The boxes highlight the ends of the lower and upper counter-arms; expanded versions of these regions are shown in the lateral panels where the circles depict the FIFI-LS aperture.
Credits
ESA/Hubble & NASA
|
|
|
Ratios of [C II]
Caption
Ratios of [C II] over far-IR emission as a function of the infrared surface brightness. The blue symbols depict observations from a comparison sample (Diaz–Santos et al. 2017) and the shaded band is the fitted curve with 1-σ uncertainty showing the zone where the [C II] emission is compatible with star formation. The black and red symbols represent the data for the northern and southern counter-arm regions, respectively.
Credits
Fadda et al. 2021
|
![Ratios of [C II] over far-IR emission as a function of the infrared surface brightness](/data/SOFIA/docs/sites/default/files/styles/lightboxgallery_height_500/public/2021-12/SCI2021_0026.png)
|
|
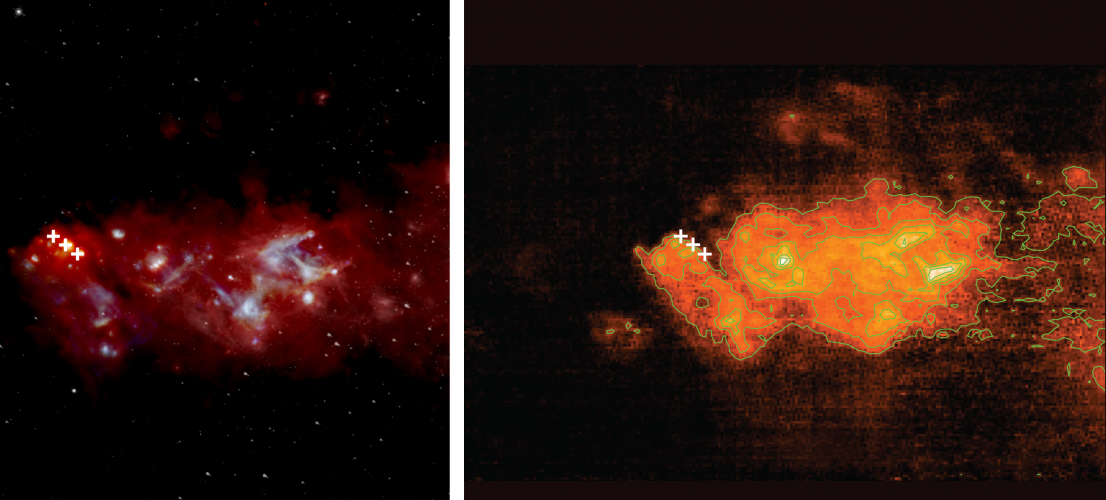
Ionized Carbon in Sagittarius B
Caption
Left: An image of the Sagittarius B region in the galactic center taken by SOFIA’s FORCAST instrument, combined with images from NASA’s Spitzer Space Telescope and the Herschel Space Observatory of the European Space Agency. Right: Ionized carbon intensity contours of the Sagittarius B region. The striped pattern is a scanning artifact due to the motion of the telescope. In both panels, crosses indicate the locations of the three star-forming cores of Sagittarius B2.
Credits
Left: NASA/SOFIA/JPL-Caltech/ESA/Herschel; Right: Harris et al., 2021
|
|
|
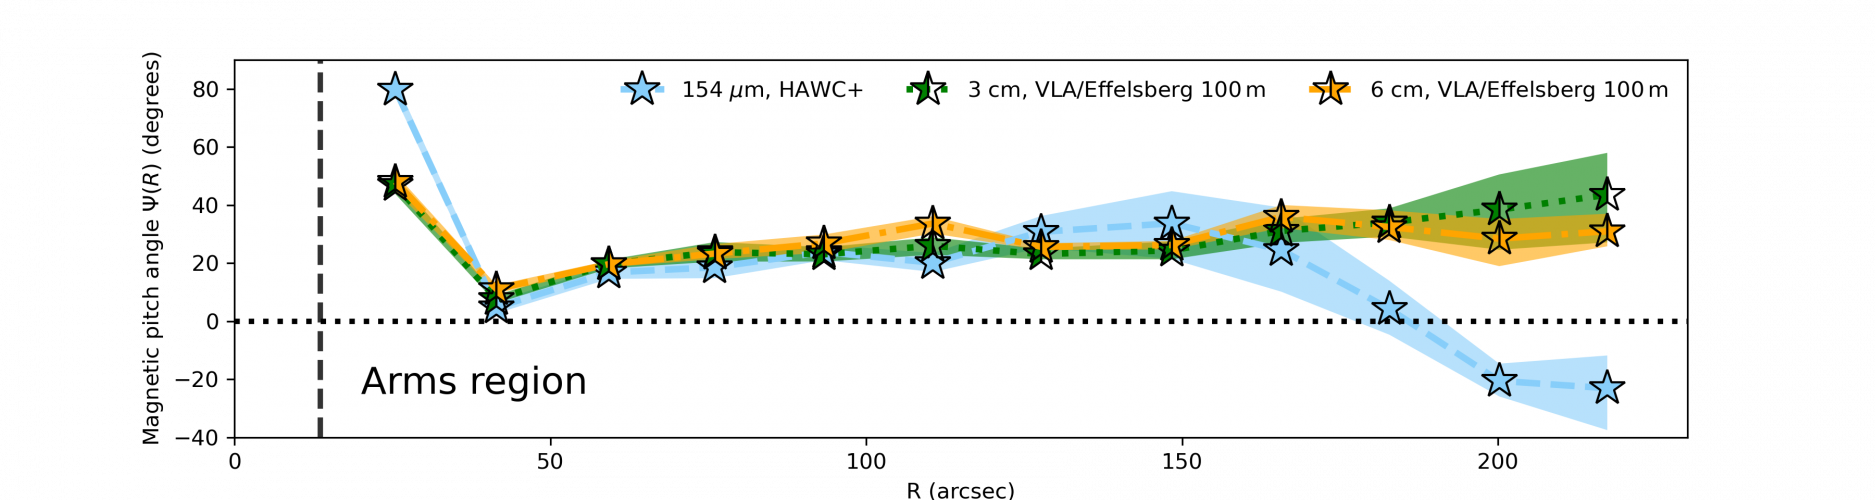
Magnetic Pitch Angle
Caption
Magnetic pitch angle, Ψ(R), as a function of the galactocentric radius, R, for the spiral arms of the Whirlpool galaxy. Profiles show the far-infrared HAWC+ observations at 154 µm (blue) and the radio observations at 3 cm (green) and 6 cm (yellow). Note that the infrared and radio profiles are co-spatial in the inner part of the galaxy, but begin to deviate at around R=165 arcsec. Shading shows the uncertainty, and the black vertical dashed line shows the central beam of the observations.
Credits
Borlaff et al. 2021
|
|
|
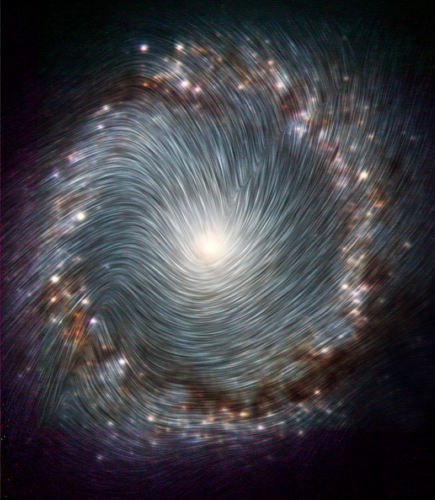
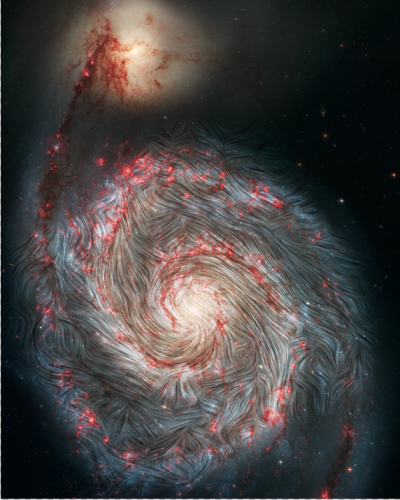
Magnetic Chaos Hidden Within the Whirlpool Galaxy
Caption
Magnetic field streamlines detected by SOFIA are shown over an image of the Whirlpool galaxy from NASA’s Hubble Space Telescope. For the first time, SOFIA’s infrared view shows that the magnetic fields in the outer arms do not follow the galaxy’s spiral shape and are instead distorted. The intense star formation activity in these regions, shown in red, may be causing the chaos, along with the forces from the yellow neighboring galaxy tugging on one of the spiral arms.
Credits
NASA, the SOFIA science team, A. Borlaff; NASA, ESA, S. Beckwith (STScI) and the Hubble Heritage Team (STScI/AURA)
|
|
|
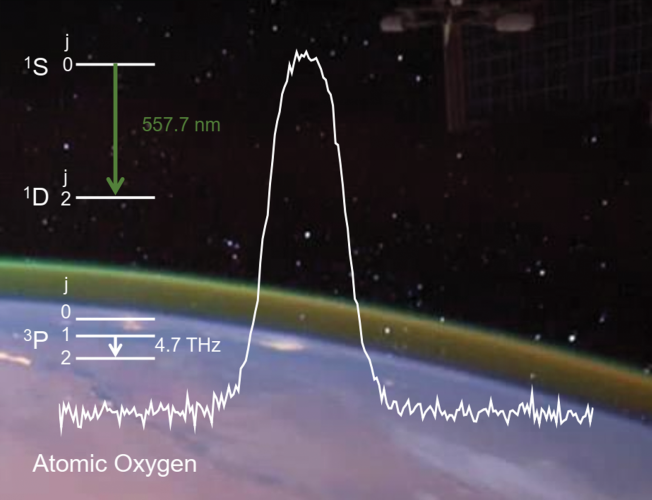
Air glow above the horizon of the Earth
Caption
Air glow above the horizon of the Earth. The green color is caused by the 557.7-nm transition of atomic oxygen as shown by its energy spectrum in the inset (not to scale). The spectrum (total width: 170 MHz) indicated by the white curve is the ground state emission of atomic oxygen at 4.7 THz. The image of the air glow was taken by astronauts aboard the International Space Station.
Credits
(DLR/NASA)
|
|
|
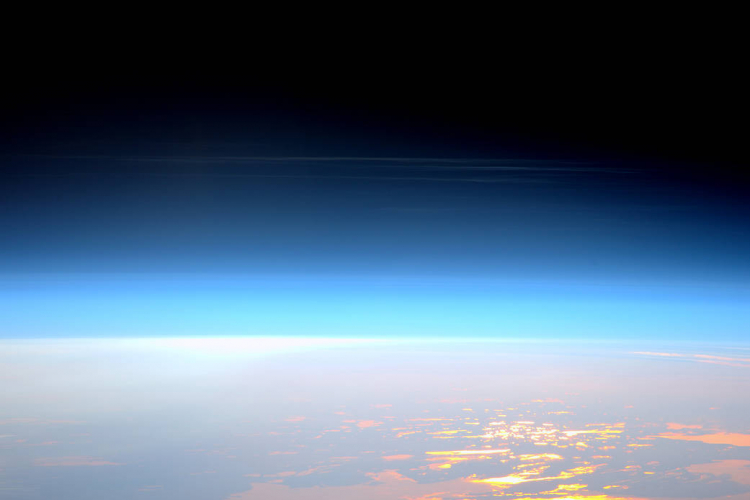
Atomic Oxygen in Earth's Upper Atmosphere
Caption
Noctilucent or “night shining” clouds forming in the mesosphere as seen from the International Space Station on May 29, 2016. These clouds form between 47 to 53 miles (76 to 85 kilometers) above Earth’s surface, near the boundary of the mesosphere and thermosphere, a region known as the mesopause. SOFIA is making direct measurements of atomic oxygen in this region, solidifying some of the basic science of how solar energy is exchanged between the Earth’s surface and space.
Credits
(ESA/NASA/Tim Peake)
|
|
|
Emissions in RCW 49
Caption
A color image of the emissions in RCW 49, the star-forming region of Westerlund 2.
Credits
Tiwari et al.
|
|
|
Maser Transition Spectra
Caption
Spectra of the 1.296 THz maser transition of water observed by the GREAT instrument on SOFIA toward the outflowing circumstellar envelopes of Mira and R Crateris. Red arrows indicate the systemic velocity of each star. Dashed lines indicate the baseline for each transition.
Credits
Neufeld et al. 2021
|

|
|
New Observations of Terahertz Water Masers with SOFIA
Caption
Artist’s impression of a pulsating variable star with an outflowing circumstellar envelope (orange) and embedded pockets of water masers (blue). The masing phenomenon occurs when a molecular transition exhibits a population inversion, and the rate of stimulated emission exceeds the rate of absorption resulting in a net negative absorption coefficient. Thus instead of being exponentially attenuated as it passes through an astrophysical medium, radiation is exponentially amplified.
Credits
Lynette Cook
|

|
|
The Age of Westerlund 1 Revisited
Caption
Image of young star cluster Westerlund 1 taken by the Hubble Space Telescope toward the southern constellation of the Altar. Westerlund 1 is home to some of the largest and most massive stars known, including four red supergiants, six yellow hypergiant stars, 24 Wolf-Rayet stars, and several more unusual stars that continue to be studied. Westerlund 1 is relatively close-by for a star cluster at a distance of 15,000 light years, giving astronomers a good laboratory to study the development of massive stars.
Credits
ESA/Hubble & NASA
|

|
|
Hertzsprung-Russel diagram for the cool supergiants in Westerlund 1
Caption
Hertzsprung-Russel diagram for the cool supergiants in Westerlund 1. The red supergiants (red circles) and yellow supergiants (yellow boxes) are plotted along with stellar isochrones (black curves). The supergiant luminosities are clearly inconsistent with the previous age estimate of 5 Myr. Instead, they appear to be an older population consistent with an age of 10 Myr.
Credits
Beasor et al. 2021
|

|
|
Carbon Dioxide in R Leonis
Caption
A portion of the spectrum of R Leonis (white) superimposed on an artistic interpretation of the star. The arrows indicate several CO₂ emission line peaks near 13.5 µm, and the yellow line is a model of Earth’s atmospheric transmission.
Credits
NASA/JPL-Caltech; Fonfría et al. 2020
|

|
|
Strongest observed CO₂ bands in R Leo
Caption
Ro-vibrational diagram of the strongest observed CO₂ bands in R Leo. The chosen stellar effective temperature is 2750 K, with a continuum flux peaking at ~2.5 µm, which causes the initial radiative excitation of the CO₂ molecules up to high energy vibrational states through the bands at 2.7 µm and 4.2 µm.
Credits
Fonfría et al. 2020
|

|
|
NGC 6334 I pre-outburst and post-outburst spectral energy distributions
Caption
Pre-outburst (blue) and post-outburst (red) spectral energy distributions from radiative transfer models for the episodic accretion event in NGC 6334 I. Blue data points are from the Very Large Telescope, Keck, Herschel, and the Sub-Milimeter Array. Red data points are from VISTA Variables in the Via Lactea (VVV) Survey, SOFIA, and ALMA.
Credits
Hunter et al. 2021
|

|
|
Episodic Accretion in High-Mass Protostars
Caption
The Cat's Paw Nebula (NGC 6334), imaged here by NASA's Spitzer Space Telescope using the IRAC instrument, is a star-forming region inside the Milky Way Galaxy. The dark filament running through the middle of the nebula is a particularly dense region of gas and dust. The inset shows the region of the high-mass protostar with pre- and post-outburst luminosity.
Credits
Cat’s Paw Nebula: NASA/JPL-Caltech; Left inset: De Buizer et al. 2000; Right inset: Hunter et al. 2021
|

|
|
[CII] 158 µm map of the Fireworks Galaxy
Caption
[CII] 158 µm map of the Fireworks Galaxy.
Credits
[CII] map: Bigiel et al. ApJ 903, 2020
|
![[CII] 158 µm map of the Fireworks Galaxy](/data/SOFIA/docs/sites/default/files/styles/lightboxgallery_height_500/public/2022-09/SCI2021_0029.png)
|
|
[CII] 158 µm map of the Fireworks Galaxy on Optical Image
Caption
[CII] 158 µm map (black contours) of the Fireworks Galaxy overlaid on optical multicolor image from the LBT (Large Binocular Telescope).
Credits
[CII] map: Bigiel et al. ApJ 903, 2020; LBT image: D. Paris, V. Testa, LBC team, and D. Thompson, LBTO)
|
![[CII] 158 µm map of the Fireworks Galaxy](/data/SOFIA/docs/sites/default/files/styles/lightboxgallery_height_500/public/2022-09/SCI2021_0028.png)
|
|
Magnetic Highway: Channeling the M82 Superwind
Caption
Magnetic fields lines in Messier 82 overlaid on a visible-and-infrared composite from the Hubble Space Telescope and the Spitzer Space Telescope. The galactic superwind from the central starburst is blasting out plumes of hot gas (red) and a halo of smoky dust (yellow/orange) perpendicular to the edge-on galaxy (white). Researchers used IR polarization data from SOFIA and tools that have been utilized extensively to study the physics around the Sun to extrapolate the potential magnetic field strength and structure up to 10 kpc around the galaxy. The field lines appear to extend indefinitely into intergalactic space, like the Sun’s solar wind, creating magnetic highways that channel star-processed matter beyond the starburst core.
Credits
NASA, SOFIA, L. Proudfit; NASA, ESA, Hubble Heritage Team; NASA, JPL-Caltech, C. Engelbracht
|

|
|
Galactic Chimneys: An Unseen Component of the Disk-Halo Interaction
Caption
Optical image of the edge-on galaxy, NGC 891, showing dark, thread-like extinction features — walls of the chimneys — extending above and below the midplane. SOFIA [C II] observations reveal a significant mass of gas in the chimney walls.
Credits
Adam Block/Mount Lemmon SkyCenter/University of Arizona
|

|