Scientific Observations Gallery
| Title | Image |
|---|---|
|
Episodic Accretion in Massive Star Formation
Caption
Artist’s impression of a stochastic accretion event as a massive fragment of the clumpy accretion disk spirals onto the protostar. Fundamental parameters of the resulting burst such as the fragment mass and the energy released can be estimated by changes to the spectral energy distribution in the infrared measured by SOFIA.
Credits
Lynette Cook
|

|
|
Strength of the radiation of the young massive star G358 as a function of the wavelength
Caption
Strength of the radiation of the young massive star G358 as a function of the wavelength. Dots mark measured values from FIFI-LS/SOFIA (red & green) and PACS/Herschel satellite (blue) and lines the modeled emission of the object. The colors mark points in time, with blue meaning before the stochastic accretion event, red during (SOFIA flight 1) and green, 18 months after (SOFIA flight 2).
Credits
Stecklum et al. 2021
|

|
|
EXES Probes the Heart of Hot-Core Chemistry
Caption
Image of the Orion KL region taken by the Gemini South Telescope. The cross marks the approximate position of the Orion hot core located at the center of an explosion generated by a multibody dynamical encounter about 500 years ago. The H₂ in red and [FeII] in blue trace finger-like tendrils resulting from the blast. The SOFIA EXES spectrum across the bottom of the image shows the Q1e–Q6e ro-vibrational transitions of the HNC molecule near 21.6 µm seen in absorption against IRc2.
Credits
Orion: Bally et al. 2015; Gemini South GSAOI; Spectrum: Nickerson et al., 2021
|

|
|
The Warped Magnetic Field of Centaurus A
Caption
Composite image of Centaurus A. Magnetic fields from SOFIA are shown as streamlines over an image of the galaxy taken at visible and submillimeter wavelengths by the European Southern Observatory and Atacama Pathfinder Experiment, X-ray wavelengths from the Chandra X-Ray observatory and infrared from the Spitzer Space Telescope.
Credits
Optical: European Southern Observatory (ESO) Wide Field Imager; Submillimeter: Max Planck Institute for Radio Astronomy/ESO/Atacama Pathfinder Experiment (APEX)/A.Weiss et al.; X-ray and Infrared: NASA/Chandra/R. Kraft; JPL-Caltech/J. Keene; SOFIA
|

|
|
First Signs of Star Birth Triggered by Orion Wind
Caption
Composite image of the Orion Nebula from SOFIA and the IRAM 30-meter radio telescope. The designated areas in the insert are densely compacted clouds with prime conditions for new stars, and in fact one newborn, low-mass star already seems to be forming there.
Credits
NASA/SOFIA/IRAM
|

|
|
SOFIA Comet Studies Explore the Carbon Gradient in the Solar System
Caption
Atomic carbon-to-silicon ratio (C/Si) loci for (1) the bulk solid Earth; (2) the Sun; (3) meteoritic materials, including both non-carbonaceous and carbonaceous chondritic classes; (4) interplanetary dust particles; (5) SOFIA studied comets; and (6) the interstellar medium.
Credits
NASA/Greg Hogan/L. Proudfit/C. Woodward
|

|
|
First Detection of 13CH in the Interstellar Medium
Caption
The first detection of 13 CH in the interstellar medium. SOFIA absorption spectrum of 13 CH corresponding rotational transition near 2 THz in the direction of SgrB2(M) superposed over a composite infrared image of the Sgr B complex. Data from SOFIA taken at 25 and 37 µm, shown in blue and green, is combined with data from the Herschel Space Observatory, shown in red (70 µm), and the Spitzer Space Telescope, shown in white (8 µm).
Credits
Jacob et al., 2020; NASA/SOFIA/JPL-Caltech/ESA/Herschel
|

|
|
Occultation Confirms Haze in Pluto’s Atmosphere
Caption
Just 15 minutes after its closest approach to Pluto on July 14, 2015, NASA’s New Horizons spacecraft looked back toward the sun and captured this near-sunset view of the rugged, icy mountains and flat ice plains extending to Pluto’s horizon. The smooth expanse of the informally named icy plain Sputnik Planum (right) is flanked to the west (left) by rugged mountains up to 11,000 feet (3,500 meters) high, including the informally named Norgay Montes in the foreground and Hillary Montes on the skyline. To the right, east of Sputnik, rougher terrain is cut by apparent glaciers. The backlighting highlights over a dozen layers of haze in Pluto’s tenuous but distended atmosphere. The image was taken from a distance of 11,000 miles (18,000 kilometers) to Pluto; the scene is 780 miles (1,250 kilometers) wide.
Credits
NASA/JHUAPL/SwRI
|

|
|
Pluto Occultation Light Curve
Caption
Light curve lower baseline at multiple wavelengths, each taken simultaneously from SOFIA. The minimum flux at the bottom of the light curves reaches different levels for the different observational wavelengths. The effective central wavelength for each observation is: 0.57 μm for HIPO-blue (in blue), 0.65 μm for FPIþ (in green), 0.81 μm for HIPO-red (in red), and 1.8 μm for FLITECAM (in black).
Credits
Person et. al., 2019
|

|
|
Cold Quasars and the Evolution of Galaxies
Caption
Illustration of the galaxy called CQ4479. The extremely active black hole at the galaxy’s center is consuming material so fast that the material is glowing as it spins into the black hole’s center, forming a luminous quasar. Quasars create intense energy that was thought to halt all star birth and drive a lethal blow to a galaxy’s growth. But SOFIA found that the galaxy CQ4479 is surviving these monstrous forces, holding on to enough cold gas, shown around the edges in brown, to birth about 100 Sun-sized stars a year, shown in blue. The discovery is causing scientists to re-think their theories of galactic evolution.
Credits
NASA/Daniel Rutter
|

|
|
The Optical Depth of [CII]: the Implications for Galaxies both Near and Far
Caption
Average spectra of the [CII] emission for M17 SW superposed on a composite image with Herschel (70 µm, red), Spitzer (3.6 µm, white), and SOFIA (37 µm, green) data. Compare the [ 12 CII] spectrum (blue) with the [ 13 CII] spectrum (red), which has been scaled up (by the 12 C/ 13 C abundance ratio of 40 and the relative satellite weight of 1/0.25). The intensity difference indicates that [ 12 CII] is optically thick, with absorption dips mimicking velocity components.
Credits
M17 SW: NASA/SOFIA/De Buizer/Radomski/Lim; NASA/JPL-Caltech; ESA/Herschel; Inset: C. Guevara et al.
|
![Average spectra of the [CII] emission for M17 SW superposed on a composite image](/data/SOFIA/docs/sites/default/files/styles/lightboxgallery_height_500/public/Public/SCI2020_0013.png "Average spectra of the [CII] emission for M17 SW superposed on a composite image")
|
|
SOFIA Detects Water on the Moon
Caption
This illustration highlights the Moon’s Clavius Crater in the southern hemisphere, where traces of water were detected by NASA's airborne observatory SOFIA. This is the first time water has been found on the sunlit surface of the Moon. The call-out depicts water molecules trapped inside tiny, glass bead-like structures within the lunar soil. These structures may prevent water from being lost to space, allowing it to remain on the harsh, nearly airless lunar surface.
Credits
NASA/Ames Research Center/Daniel Rutter
|

|
|
Molecular Processing in the Disks of Massive Stars
Caption
Illustration of a dusty disc rotating around a massive newborn star that’s about 40 times the size of the Sun. SOFIA found the inner regions of two of these kinds of discs are filled with organic molecules that are important for life as we know it. These include water, ammonia, methane, and acetylene — which is a chemical building block to larger and more complex organic molecules — illustrated in the call out.
Credits
NASA/SOFIA
|

|
|
A Magnetic Hourglass Detection for a Low-Mass Protostar
Caption
A portion of the Lupus I cloud complex. Color shows the emission by interstellar dust grains at three different wavelengths observed by Herschel (250, 350, and 500 microns). Streamlines show the associated magnetic fields based on Planck polarization data. The inset shows a HAWC+ total intensity image of the low-mass protostellar core, IRAS 15398-3359. The superposed streamlines from HAWC+ polarization data show that the magnetic fields are beginning to take on the expected hourglass shape.
Credits
Background: ESA/Herschel/Planck; J. D. Soler, MPIA; Inset: Redaelli et al., 2019.
|

|
|
Stokes I map of IRAS 15398 obtained with HAWC+
Caption
The Stokes I map of IRAS 15398 obtained with HAWC+, with overlaying polarization vectors from SOFIA (black) and from optical (green) polarimetry. The protostar position is shown with a star, and arrows show the outflow direction.
Credits
Redaelli et al., 2019.
|

|
|
Magnetized Filamentary Gas Flows in Serpens South
Caption
Composite image of the Serpens South Cluster. Magnetic fields observed by SOFIA are shown as streamlines over an image from the Spitzer Space Telescope. SOFIA results indicate that gravity can overcome some of the strong magnetic fields to deliver material needed for new stars. The magnetic fields have been dragged into alignment with the most powerful flows, as seen in the lower left where the streamlines are following the direction of the narrow, dark filament. This is accelerating the flow of material from interstellar space into the cloud, and fueling the collapse needed to spark star formation.
Credits
NASA/SOFIA/T. Pillai; NASA/JPL-Caltech/L. Allen
|

|
|
Mira Star and Helix
Caption
Infrared spectra from SOFIA help reveal fundamental differences between the dust produced by two types of carbon-rich variable stars. Miras, well-known for their long pulsation periods and strong amplitudes, are producing copious amounts of amorphous carbon dust, while the semi-regulars form mainly SiC. These results help unravel the mystery of how the carbon produced inside stars gets out into the interstellar medium to provide not only the raw material for future generations of star formation, but also the methane in the atmospheres of planets and exoplanets as well as the DNA that forms the basis of life as we know it.
Credits
Izan Leao; the Very Large Telescope/© Viks_jin - stock.adobe.com
|

|
|
The Chemical Enrichment of the Universe
Caption
[6]-[9] vs. SiC strength for carbon stars in the Milky Way. The [6]-[9] color is constructed from small, feature-free wavelength ranges of the spectra at 6 and 9 µm and traces the amorphous carbon content, with redder colors (higher x-axis values) indicating more amorphous carbon. Gray asterisks are Galactic carbon stars that are neither Miras nor SRb variables.
Credits
Kraemer et al., 2019.
|
![[6]-[9] vs. SiC strength for carbon stars in the Milky Way](/data/SOFIA/docs/sites/default/files/styles/lightboxgallery_height_500/public/Public/SCI2020_0006.png "[6]-[9] vs. SiC strength for carbon stars in the Milky Way")
|
|
SOFIA Reveals the Complex Nature of a 'Simple' Star Formation Tracer
Caption
Spectrum (histogram) of [ 13 CII] emission in the star-forming region N159W superposed on an image from Hubble Space Telescope of the Large Magellanic Cloud. The blue curve is the scaled emission that would be expected if the [ 12 CII] emission from the same region were optically thin. The observed intensity of [ 13 CII] is stronger than the scaled emission, indicating that [ 12 CII] is optically thick.
Credits
NASA/SOFIA/L. Proudfit; Hubble Space Telescope
|
![Spectrum of [13CII] emission in star-forming region N159W on an image of the Large Magellanic Cloud](/data/SOFIA/docs/sites/default/files/styles/lightboxgallery_height_500/public/Public/SCI2020_0005.png "Spectrum of [13CII] emission in star-forming region N159W on an image of the Large Magellanic Cloud")
|
|
Spectrum of the [^12CII] and [^13CII] emission
Caption
Spectrum of the [ 12 CII] and [ 13 CII] emission at the position where the integrated intensity of [CII] is strongest in the star-forming region N159W in the Large Magellanic Cloud. The blue line overlaid on the [ 13 CII] spectrum is the scaled [ 12 CII] emission that would be expected if the [ 12 CII] emission were optically thin. The observed intensity of [ 13 CII] is stronger than the scaled [ 12 CII], indicating that the [ 12 CII] emission is optically thick.
Credits
Okada et. al., 2019.
|
![Spectrum of emissions where integrated intensity of [CII] is strongest in Large Magellanic Cloud](/data/SOFIA/docs/sites/default/files/styles/lightboxgallery_height_500/public/Public/SCI2020_0004.png "Spectrum of emissions where integrated intensity of [CII] is strongest in Large Magellanic Cloud")
|
|
The Role of the Magnetic Field in the Galactic Center
Caption
A composite image of the central region of our Milky Way galaxy, known as Sagittarius A. SOFIA found that magnetic fields, shown as streamlines, are strong enough to control the material moving around the black hole, even in the presence of enormous gravitational forces. SOFIA’s results can help answer long-standing, fundamental questions about the galactic center region: why the star formation rate is significantly lower than expected and why our galaxy’s black hole is quieter than those in other galaxies. SOFIA data is shown in green (37 microns) and dark blue (25 and 53 microns). The light blue is from Herschel Space Observatory (70 microns) and the gray is from the Hubble Space Telescope.
Credits
NASA/SOFIA/L. Proudfit; ESA/Herschel; Hubble Space Telescope
|

|
|
Signatures of Star Formation in the Galactic Center
Caption
Composite infrared image of the center of our Milky Way Galaxy. It spans 600+ lightyears across and is helping scientists learn how many massive stars are forming in our galaxy’s center. New data from SOFIA taken at 25 and 37 microns shown in blue and green, is combined with data from the Herschel Space Observatory shown in red (70 microns) and the Spitzer Space Telescope shown in white (8 microns). SOFIA’s view reveals features that have never been seen before.
Credits
NASA/SOFIA/JPL-Caltech/ESA/Herschel
|

|
|
Massive Star Formation in the Omega Nebula
Caption
Composite image of the Swan Nebula. SOFIA detected the blue areas (20 microns) near the center, revealing gas as it’s heated by massive stars located at the center, near the bend, and the green areas (37 microns) that trace dust as it’s warmed both by massive stars and nearby newborn stars. The nine never-before-seen protostars were found primarily in the southern areas. The red areas near the edge represent cold dust that was detected by the Herschel Space Telescope (70 microns), while the white star field was detected by the Spitzer Space Telescope (3.6 microns). The space telescopes could not observe the blue and green regions in such detail because the detectors were saturated. SOFIA’s view reveals evidence that parts of the nebula formed separately to create the swan-like shape seen today.
Credits
NASA/SOFIA/Lim, De Buizer, & Radomski et al.; ESA/Herschel; NASA/JPL-Caltech
|

|
|
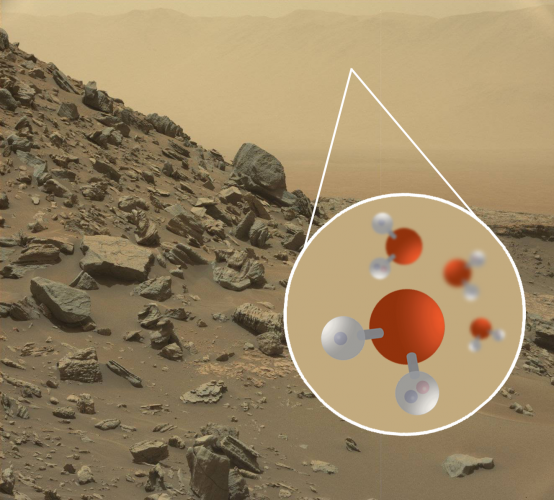
Clues to Mars’ Lost Water
Caption
Image of a sloping hillside from the Mars Curiosity rover and an illustration of deuterated water molecules, called HDO instead of H2O because one of its hydrogen atoms has an extra neutrally charged particle. Infrared observations can study these particles that retrace the history of liquid water because the heavier molecules are more likely to remain even after liquid water has evaporated. SOFIA’s observations reveal this tracer of liquid water does not vary between Martian seasons, bringing scientists closer to understanding just how much liquid water Mars once had.
Credits
NASA/JPL-Caltech/MSSS/SOFIA
|
|
|
Magnetic Fields in Galaxy NGC 1068
Caption
Magnetic fields in NGC 1068, or M77, are shown as streamlines over a visible light and X-ray composite image of the galaxy from the Hubble Space Telescope, The Nuclear Spectroscopic Array, and the Sloan Digital Sky Survey. The magnetic fields align along the entire length of the massive spiral arms — 24,000 light years across (0.8 kiloparsecs) — implying that the gravitational forces that created the galaxy’s shape are also compressing the galaxy’s magnetic field. This supports the leading theory of how the spiral arms are forced into their iconic shape known as “density wave theory.” SOFIA studied the galaxy using far-infrared light (89 microns) to reveal facets of its magnetic fields that previous observations using visible and radio telescopes could not detect.
Credits
NASA/SOFIA; NASA/JPL-Caltech/Roma Tre Univ.
|

|
|
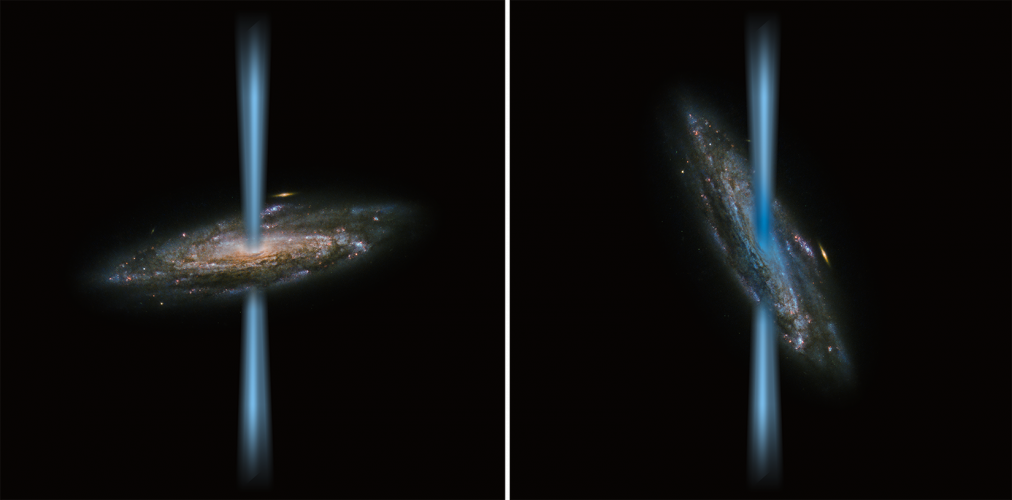
Active Black Hole Jet
Caption
Artist’s concept of a jet from an active black hole that is perpendicular to the host galaxy (left) compared to a jet that is launching directly into the galaxy (right) illustrated over an image of a spiral galaxy from the Hubble Space Telescope. SOFIA found a strange black hole with jets that are irradiating the host galaxy, called HE 1353-1917. The galaxy has 10 times more ionized carbon than its stars could produce. The gas, illustrated in blue in the right image, is concentrated near the galaxy’s center, which indicates that the intense radiation from the black hole’s jet is the source of the excess gas. This contradicts the long-held assumption that ionized carbon primarily indicates the presence of newborn stars, and forces scientists to reevaluate the effect black holes have on galaxies.
Credits
ESA/Hubble & NASA and NASA/SOFIA/L. Proudfit
|
|
|
Planetary Collisions in a Binary Star System
Caption
Artist’s concept illustrating a catastrophic collision between two rocky exoplanets in the planetary system BD +20 307, turning both into dusty debris. Ten years ago, scientists speculated that the warm dust in this system was a result of a planet-to-planet collision. Now, SOFIA found even more warm dust, further supporting that two rocky exoplanets collided. This helps build a more complete picture of our own solar system’s history. Such a collision could be similar to the type of catastrophic event that ultimately created our Moon.
Credits
NASA/SOFIA/Lynette Cook
|

|
|
Star Formation Across Cosmic Time
Caption
[C II] line luminosity as a function of FIR luminosity. Our five CARS targets are shown as red triangles compared to the literature compilation of Herrera-Camus et al. (2018a): normal star-forming and star-burst galaxies (green circles), AGN host galaxies (purple triangles), LINER galaxies (orange upside-down triangles), and high-redshift galaxies including the samples from Brisbin et al. (2015) and Decarli et al. (2018) (brown diamonds). The blue line is the mean of the low-redshift galaxies distribution, and the blue-shaded areas correspond to 1, 2, and 3σ. Pink and purple shades represent LIRG L FIR > 10 11 and ULIRG L FIR > 10 12 regimes. The luminosities for 3C 326 are taken from Guillard et al. (2015).
Credits
Smirnova-Pinchukova, I., et al.
|

|
|
Galactic Center
Caption
Streamlines showing magnetic fields layered over a color image of the dusty ring around the Milky Way’s massive black hole. The Y-shaped structure is warm material falling toward the black hole, which is located near where the two arms of the Y-intersect. The streamlines reveal that the magnetic field closely follows the shape of the dusty structure. Each of the blue arms has its own field that is totally distinct from the rest of the ring, shown in pink.
Credits
Galactic Center dust and magnetic fields: NASA/SOFIA, star field image: NASA/Hubble Space Telescope
|

|
|
SOFIA Observations Fuel Debate about the Origin of the Earth’s Oceans
Caption
Illustration of a comet, ice grains and Earth’s oceans. SOFIA found clues in Comet Wirtanen’s ice grains that suggest water in comets and Earth’s oceans may share a common origin.
Credits
NASA/SOFIA/L. Cook/L. Proudfit
|

|