Scientific Observations Gallery
| Title | Image |
|---|---|
|
First Images Demonstrate the Capabilities of SOFIA’s New Instrument
Caption
This image shows how dust grains are aligned in the W3 star-forming region, a giant molecular cloud in the constellation Cassiopeia approximately 6,200 light years from Earth. Researchers are now comparing data from these observations with models that predict how stars form.
Credits
NASA/SOFIA/Caltech/Darren Dowell
|

|
|
SOFIA Sees Super-Heated Gas Streams Churning up Possible Storm of New Stars
Caption
Map of Cepheus E emphasizing the jets of material flowing to the upper left and lower right from the protostar. The protostar itself is the central yellow-red 'blob" in the colored background map of hydrogen emission made at a wavelength of 4.5 microns by the Spitzer infrared space telescope. The contour curves show the strength of emission from cool carbon monoxide gas measured by the Plateau de Bure radio telescope located in the French Alps. Lefloch et al. used GREAT on SOFIA to measure the amount and velocity of hot carbon monoxide gas at multiple positions along both "wings" of the outflow jet.
Credits
Lefloch et al. 2015 Figure 1
|

|
|
“Kitchen Smoke” Molecules in Nebula Offer Clues to the Building Blocks of Life
Caption
Combination of three color images of NGC 7023 from SOFIA (red & green) and Spitzer (blue) show different populations of PAH molecules.
Credits
NASA/DLR/SOFIA/B. Croiset, Leiden Observatory, and O. Berné, CNRS; NASA/JPL-Caltech/Spitzer
|
 and Spitzer (blue) show different populations of PAH molecules.")
|
|
SOFIA Pinpoints Water Vapor in Young Star
Caption
Infrared spectrum of the protostar AFGL 2591 made by the EXES instrument on SOFIA, superimposed on an infrared image of the protostar and the nebula that surrounds it, made by the Gemini Observatory.
Credits
Spectrum Image: NASA/DLR/USRA/DSI/EXES Team/N. Indrolio (U. Michigan & JHU); Credit Background Image: C. Aspin et al. / NIRI / Gemini Observatory / NSF.
|
|
|
SOFIA Witnesses the Emergence of a Carbon Star
Caption
SOFIA/FORCAST images of the planetary nebula BD+30 3639. The blue circles have radii of 5 arcsec (6000 AU). Dust with strong emission features indicating O-rich versus C-rich compositions have different radial extents.
Credits
Guzman-Ramirez et al. 2015, Figure 1
|

|
|
SOFIA Witnesses the Emergence of a Carbon Star
Caption
Three-dimensional model using Moccasin , a self-consistent 3-D Monte Carlo radiative transfer code. The blue dotted line is the total spectrum given by the model. The contributions of O-rich and C-rich dust are shown respectively in cyan and in pink. The green crosses are SOFIA flux measurements in filters that include dust features. The red line is an ISO spectrum.
Credits
Guzman-Ramirez et al. 2015, Figure 4
|

|
|
SOFIA/GREAT Detection of Atomic Oxygen in the Martian Atmosphere
Caption
SOFIA/GREAT [O I] spectrum at 4.7 THz (63 μm) superimposed on a picture of Mars. Absorption line depth is approximately 10% of the continuum. The abundance of atomic oxygen computed from the data is less than expected from the Forget et al. 1999 global circulation & photochemical model.
Credits
SOFIA/GREAT spectrum: NASA/DLR/USRA/DSI/MPIfR/GREAT Consortium/MPIfS/Rezac et al. 2015; Mars image: NASA
|
![SOFIA/GREAT [O I] spectrum at 4.7 THz (63 μm) superimposed on a picture of Mars.](/data/SOFIA/docs/sites/default/files/styles/lightboxgallery_height_500/public/MarsGREAT.jpg "SOFIA/GREAT [O I] spectrum at 4.7 THz (63 μm) superimposed on a picture of Mars.")
|
|
SOFIA/GREAT Detection of Atomic Oxygen in the Martian Atmosphere
Caption
(a) SOFIA/GREAT far-IR spectrum centered on the telluric OI line, demonstrating clear detections of atomic oxygen absorption in both atmospheres. (b) Spectrum centered on the Martian atmospheric [O I] line, shown in relative flux units.
Credits
Rezac et al. 2015, A&A 580, L10
|

|
|
NGC 7023 at 3.3 μm
Caption
A 3.3 μm polycyclic aromatic hydrocarbon (PAH) filter was used to study the photochemical evolution of PAHs in the reflection nebula NGC 7023. The filter is narrow, Δλ=0.09 μm, and isolates the PAH emission. The plate scale is 0.475 arcsec/pixel and the angular resolution is about 2 arcsec, dominated by telescope jitter. FORCAST also performed observations of NGC 7023 (at 11.2 μm) and the combined data shows a peak in the 11.2/3.3 μm ratio, corresponding to PAHs of ~50 C-atoms. This supports models claiming the photochemical evolution of PAHs is size-dependent and most efficient for PAHs with ~50 C-atoms.
Credits
Croiset et al. 2016, A&A, 590, A26.
|

|
|
NGC 7023
Caption
FORCAST has been used to collect 11.1 μm data of NGC 7023 (top left) which was then combined with FLITECAM 3.3 μm data and Spitzer/IRAC 8.0 μm data (top right) to yield a plot of the 11.2/3.3 μm flux ratio revealing the PAH size distribution (bottom). FORCAST observations provide higher angular resolution than Spitzer which thereby enables the PAH size distribution to be traced through the ratio of 11.2 μm emission to the SOFIA/FLITECAM 3.3 μm data. The famous reflection nebula NGC 7023 was observed with FORCAST in order to better understand the photochemical evolution of polycyclic aromatic hydrocarbons (PAHs) resulting from illumination by the nearby star HD 200775. Similarities to the H2 flux (contours) indicate that the smallest PAH molecules lie on the surface of the PDR.
Credits
Croiset et al. 2016, A&A, 590, A26.
|

|
|
Horsehead Nebula: Velocity Resolved [C II] Map
Caption
A velocity resolved map of the iconic Horsehead Nebula in the [C II] 158 μm line was obtained by the upGREAT Low Frequency Array (LFA). The [CII] line is one of the strongest cooling lines in the interstellar medium, and here it traces the photodissociation region illuminated by the O9.5V star Sigma Orionis. The integrated intensity image is shown in the figure to the right. The 12’x17’ map, encompassing the nebula and the underlying cloud ridge, was obtained in just over 4 hours of observation on a single flight. The angular resolution of the map is 15.1” and the velocity resolution is 0.19 km/s (R > 106). These remarkably efficient observations were made possible by an increase in the sensitivity of the upGREAT detectors with the use of fourteen independent detectors of the LFA, and the increased mapping speed facilitated by SOFIA’s inertially stable platform.
Credits
SOFIA/upGREAT
|

|
|
Ionized H2D observations give an age of one million years for a cloud core forming Sun-like stars
Caption
Observed and modeled H 2 D+ spectra using APEX/FLASH and SOFIA/GREAT towards a protostar core IRAS 16293-2422. The observed ortho/para H 2 D+ ratio sets a limit on the age of the cloud core of less than one million years.
Credits
Brünken et al. 2014, Nature, 13924
|

|
|
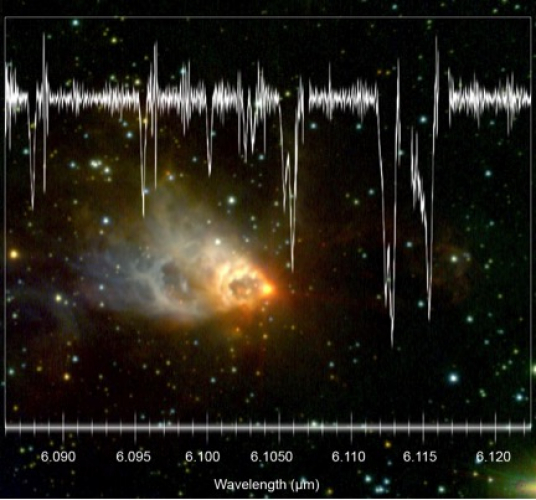
Water Around the Protostar AFGL 2591
Caption
Spectra of protostar AFGL 2591 and standard star Vega from 6.085 to 6.130 microns, superimposed. This specific wavelength range is not observable from any ground-based observatory. The strong absorption lines (wavelengths with low intensity) appearing in both spectra are caused by water vapor in Earth’s atmosphere.
Credits
Indriolo et al.
|

|
|
SOFIA Observes Extrasolar Planet HD 189733b
Caption
Absolute photometry of a transit of HD 189733b observed by SOFIA/HIPO in the z’ (905 nm) bands, corrected for extinction, flat field, and correlated noise. Plotted data points represent averages of 87 (z’ band) individual measurements. The blue curve shows model fits to the data; the lower plot shows residuals relative to the model fits.
Credits
Angerhausen et al.
|

|
|
Pluto Stellar Occultation
Caption
The 2015 stellar occultation by Pluto of a background star with an r-band of magnitude ~12 was captured by FPI+ as a light curve, showing the decreased signal (in magnitudes) during the event. The central flash in the middle of the light curve confirms the precise position of SOFIA on the centerline of the shadow path, allowing for analysis of the upper atmosphere. This results in a best-fit value for the occultation half-light radius of 1288±1 km (i.e., the radius in the atmosphere at which the occultation light curve drops to half its original flux due to refraction).
Credits
Bosh et al. 2016
|

|
|
V339 Delphini
Caption
The early temporal development of the classical nova V339 Delphini was observed using FORCAST grisms, which provide coverage from 5–40 μm at low spectral resolution. These data revealed a full suite of hydrogen recombination lines, the analysis of which indicated that the ejecta were still at very high density (ne > 1013 cm-3) and that the hydrogen lines were optically thick.
Credits
Gehrz et al. 2015, ApJ, 812, 132.
|

|
|
SN 2014J Spectrum
Caption
FLITECAM observed the H + K-band spectrum on Feb. 19, 2014 and Feb. 27, 2014 with strong emission features at 1.55-1.65 μm and 1.77 μm. The detail of the geometry of the 1.77 μm emission peak has enabled it to be identified as permitted lines of Co ΙΙ rather than a blend of Fe group lines and Co ΙΙ as previously believed. The strongest emission lines of Co ΙΙ and [Co ΙΙΙ] are presented in the bottom of each plot, and triangles indicate the locations of lines predicted to be strong in the model for comparison. Favorable atmospheric transmission achievable in the stratosphere onboard SOFIA has enabled FLITECAM spectra to be the only data collected on SN 2014J that spans the entire feature profile.
Credits
Vacca, W. D. et al., 2015, ApJ, 804, 66.
|

|
|
Sagittarius A East Supernova Remnant
Caption
SOFIA data reveal warm dust (white) surviving inside a supernova remnant. The SNR Sgr A East cloud is traced in X-rays (blue). Radio emission (red) shows expanding shock waves colliding with surrounding interstellar clouds (green).
Credits
NASA/CXO/Herschel/VLA/SOFIA-FORCAST/Lau et al.
|

|
|
Supernova Remnant Ejecta
Caption
Supernova remnant dust detected by SOFIA (yellow) survives away from the hottest X-ray gas (purple). The red ellipse outlines the supernova shock wave. The inset shows a magnified image of the dust (orange) and gas emission (cyan).
Credits
NASA/CXO/Herschel/VLA/SOFIA-FORCAST/Lau et al.
|

|
|
The Galaxy's Central Molecular Zone
Caption
NANTEN CO (1-0) map. The region mapped by Herschel/HIFI is marked as a yellow box. Positions of ionized carbon [C II] and nitrogen [N II] observations by SOFIA/GREAT are indicated by crosses.
Credits
W. D. Langer, P. F., Goldsmith, J. D. Pineda, T. Velusamy, M. A., Requena-Torres, and H. Wiesemeyer
|

|
|
Ionized Carbon at the Center of Galaxy IC 342
Caption
SOFIA/GREAT [CII] spectrum (green) toward IC 342 nuclear southern giant molecular cloud complex, compared with spectra of CO molecular lines observed by the BIMA (Berkeley Illinois Maryland Association) telescope & the JCMT (James Clerk Maxwell Telescope). The spectra were scaled by factors between 0.5 and 2 for clarity.
Credits
GREAT Consortium
|

|
|
Dusty Cradles in a Turbulent Nursery: The Sgr A East H II Complex at the Galactic Center
Caption
SOFIA/FORCAST mid-IR image of the Sagittarius A East region in the Galactic Center at wavelengths of 19.7 (blue), 31.5 (green), and 37.1 microns (red). The locations of faint infrared sources FIRS 1 & 2 are given by the yellow crosses.
Credits
Lau, Herter, Morris, & Adams
|

|
|
GREAT high-resolution spectrum of [O I] emission at 63.2 microns (4.74 THz) toward the center of planetary nebula NGC 7027
Caption
This high-resolution spectrum of neutral oxygen at 4.74 terahertz (63.2 microns) observed near the center of NGC 7027 shows several maxima and minima, showing that the expanding nebula has a complex structure with multiple components moving at different velocities.
Credits
GREAT Consortium
|
![GREAT high-resolution spectrum of [O I] emission at 63.2 microns (4.74 THz) toward the center of planetary nebula NGC 7027](/data/SOFIA/docs/sites/default/files/styles/lightboxgallery_height_500/public/SCI2014_0009.jpg "GREAT high-resolution spectrum of [O I] emission at 63.2 microns (4.74 THz) toward the center of planetary nebula NGC 7027")
|
|
GREAT spectral map of planetary nebula NGC 7027 in [O I] emission at 63.2 microns (4.74 THz)
Caption
Map of planetary nebula NGC 7027 in the neutral oxygen emission line at 63 microns constructed from spatial scans made by the GREAT spectrometer’s H-channel receiver. The effective angular resolution is indicated by the gray circle at lower left.
Credits
GREAT Consortium
|
![GREAT spectral map of planetary nebula NGC 7027 in [O I] emission at 63.2 microns (4.74 THz)](/data/SOFIA/docs/sites/default/files/styles/lightboxgallery_height_500/public/SCI2014_0008.jpg "GREAT spectral map of planetary nebula NGC 7027 in [O I] emission at 63.2 microns (4.74 THz)")
|
|
EXES spectral maps of H2 emission on Jupiter at 17.0 and 28.3 microns
Caption
EXES spectral maps of H 2 emission on Jupiter at 17.0 and 28.3 microns.
Credits
<p>NASA/SOFIA</p>
|

|
|
H20 detected by EXES in the high-mass protostar AFGL 2591
Caption
H 2 0 detected by EXES in the high-mass protostar AFGL 2591
Credits
<p>NASA/SOFIA</p>
|

|
|
FIFI-LS Far-IR spectral imaging of the Orion Nebula
Caption
Right: The Becklin-Neugebauer object, the Trapezium stars, and the Orion Bar observed using FIFI-LS at wavelengths of 63, 145, and 157 microns, corresponding to prominent lines of neutral oxygen [OI] and singly ionized carbon [CII] (FIFI-LS Team). Left: Spitzer image of the Orion Nebula (red: 8 μm, orange: 5.8 μm, green: 4.5 μm, blue: 3.6 μm; Thomas Megeath). The red contours indicate the position of the FIFI-LS observation mosaics.
Credits
<p>Right: FIFI-LS Team; Left: Thomas Megeath</p>
|

|
|
FIFI-LS detection of [O III] emission from the planetary nebula NGC 6543
Caption
(Left) First FIFI-LS spectral map of planetary nebula NGC 6543 at 51.815 microns, Each of the 25 pixels is 6 x 6 arc seconds in size, corresponding to about 1/10 of a light year at NGC 6543’s distance of 3000 light years. (Copyright: The FIFI-LS Team) (Right) The FIFI-LS field of view is shown superimposed on a image of NGC 6543 taken by the Nordic Optical Telescope (La Palma, Spain) in filters [N II] λ6584 (= red) and [O III] λ5007 Å (= blue and green). (Copyright: R.L.M. Corradi, Isaac Newton Group, and D. Goncalves, Instituto de Astrofísica de Canarias.)
Credits
<p>Left: The FIFI-LS Team; Right: R.L.M. Corradi, Isaac Newton Group, and D. Goncalves, Instituto de Astrofísica de Canarias</p>
|
![FIFI-LS detection of [O III] emission from the planetary nebula NGC 6543](/data/SOFIA/docs/sites/default/files/styles/lightboxgallery_height_500/public/SCI2014_0007.jpg "FIFI-LS detection of [O III] emission from the planetary nebula NGC 6543")
|
|
SOFIA near-IR spectrum of M82 Supernova 2012J
Caption
FLITECAM flux-calibrated spectra of SN 2014J on the four different observing dates. Regions of strong telluric absorption from the ground (transmission < 20%) are shown in dark gray, while regions of moderate telluric absorption from the ground (transmission < 80%) are shown in light gray (cf., for example, Rayner et al. 2009).
Credits
<p>NASA/SOFIA/W. Vacca</p>
|

|
|
SOFIA near-IR image of Supernova 2014J
Caption
Two images of the central portions of galaxy M82 that include the position of Supernova 2014J (north is at the top, east is to the left in these images). (left) Near-infrared image from the 2-Micron All-Sky Survey (2MASS), before the supernova explosion. (right) Image of M82 including the supernova at near-infrared wavelengths J, H, and K (1.2, 1.65, and 2.2 microns), made Feb. 20 by the FLITECAM instrument on SOFIA.
Credits
<p>NASA/SOFIA/FLITECAM team/S. Shenoy</p>
|

|