IRAC High Precision Photometry
Dataset:
wasp-38b ch2
wasp-13b ch2
HD209458 ch1 Feb 2014
55cnc r43981568
Symptoms:
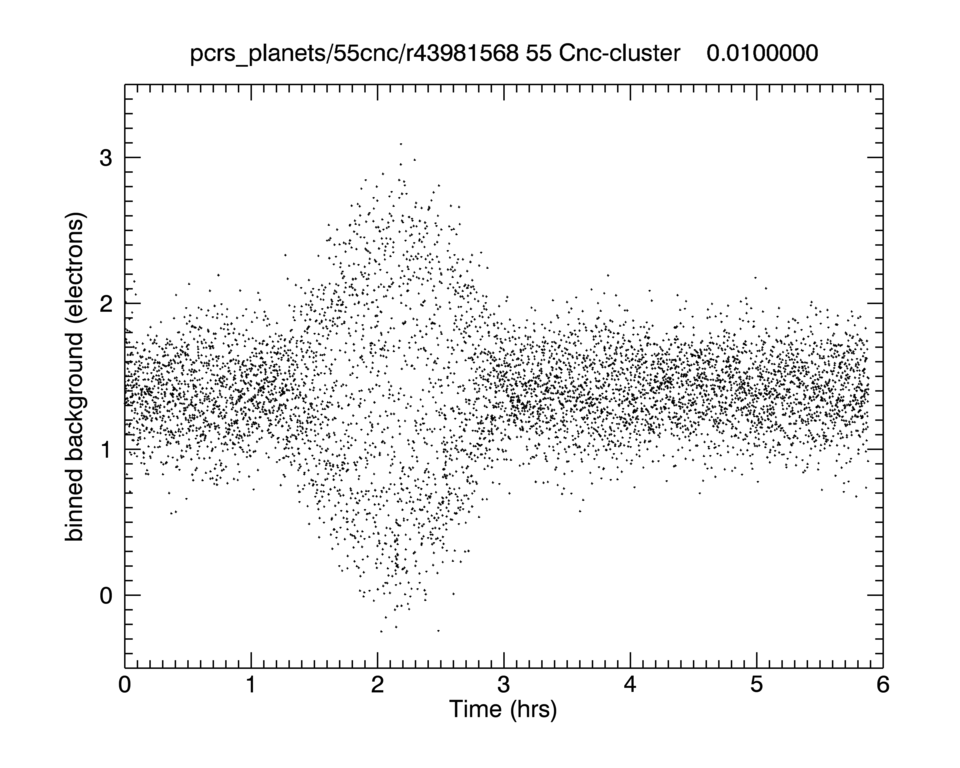
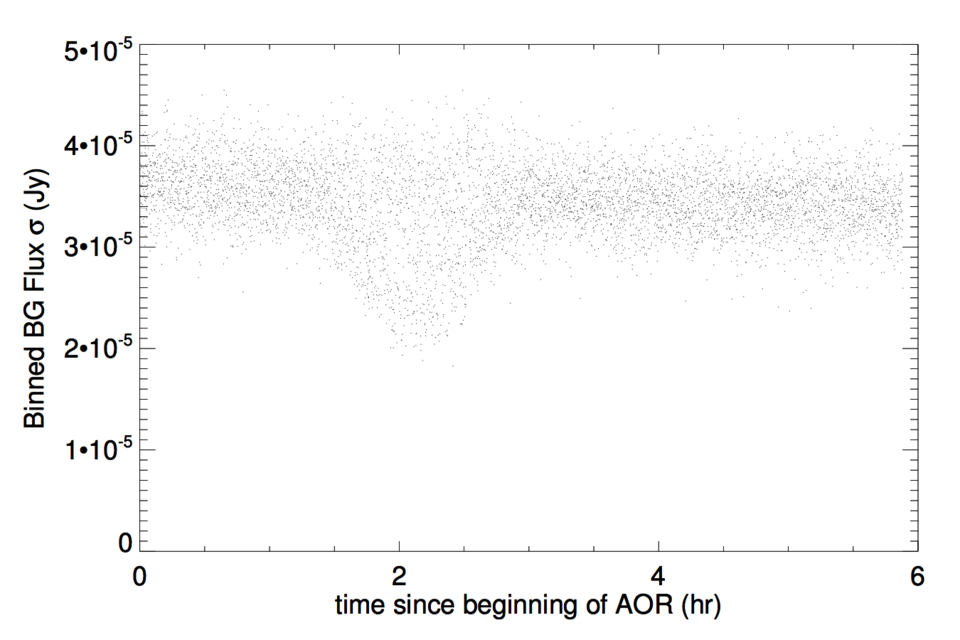
Demory et al. 2011 and 2012 first report the detection of a background modulation( ’background explosion’ in their terminology) in 3 out of 5 of their published AORs. We have since seen this in a number of AORs, although it is not very common. The modulation is of order 1 electron for roughly 2 hours, although duration varies (See Figure 1). We do see that the signal is correlated. Figure 2 shows a decrease in background noise during the modulation period.
Explanation:
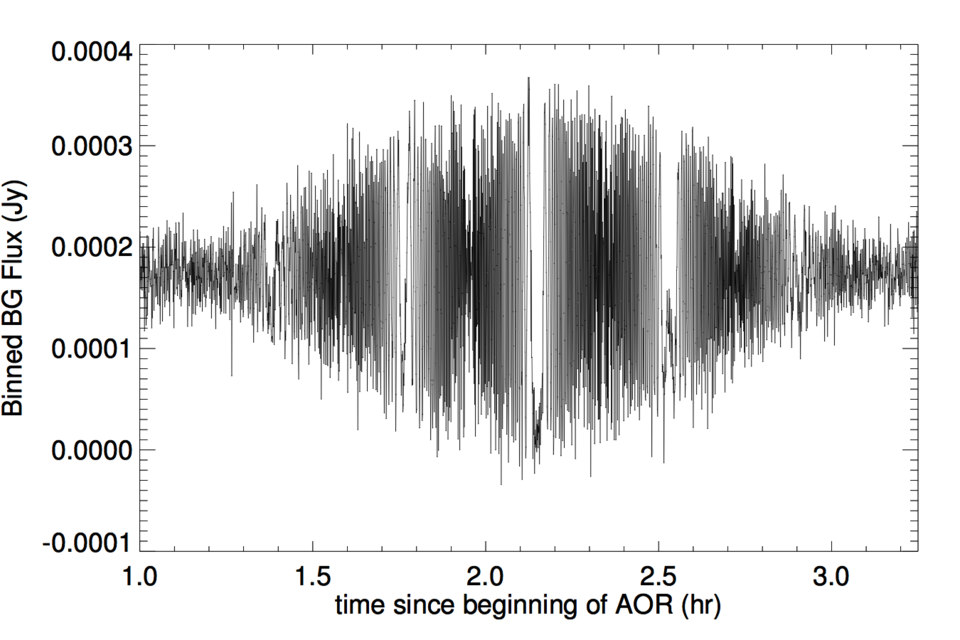
We looked into this in Fall 2012 somewhat extensively, and were not able to find anything in the telemetry that changes during the time of the modulation or which correlates with frequencies seen in the modulation. The signal does appear to be correlated, in that if you connect the dots (Figure 3) there is coherent structure in the background modulated by an expanding and contracting envelope. There is similar coherent structure in the background sigma. The noise in the background only goes down during that time. There are what look like gaps in the waveform, corresponding to regions where the BG is extremely correlated over timescales of about 5 min. These gaps seem to be synchronized with extrema in the position sawtooth. The analogy we are currently using to try to understand this is that it is somewhat similar to frequency modulation (FM) and amplitude modulation(AM) signals.
We see no evidence of the background modulation affecting the photometry.

Figure 1: Background measured in electrons as a function of time for 0.02s subarray data.

Figure 2: Background sigma during the same observation as Figure 1.

Figure 3: Same as Figure 1, only now with each data point connected by a line, and zoomed in on the background modulation portion of the light curve.