IRAC High Precision Photometry
Dataset:
55Cnc
r48072704 1hrs into the observation ~ 2013-07-08T12:55:21.630'
r48072960 3hrs into the observation ~2013-07-11T13:26:19.537
more sclk times:
1062887000.00
1062602000.00
1062610000.00
1041435000.00
1043545000.00
1047548000.00
1058016500.00
1057755000.00
Symptoms:
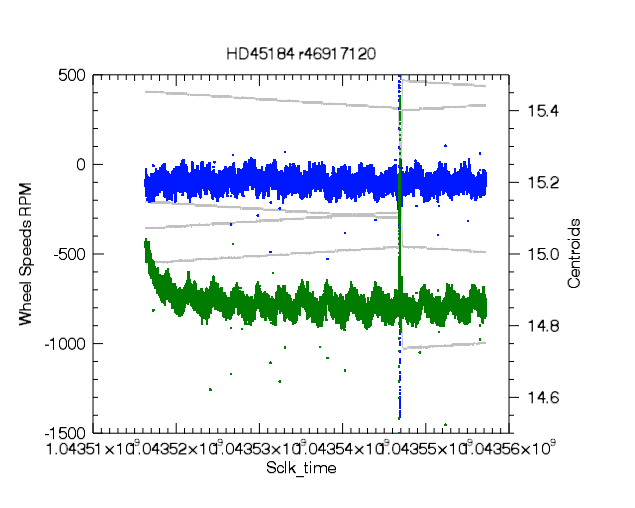
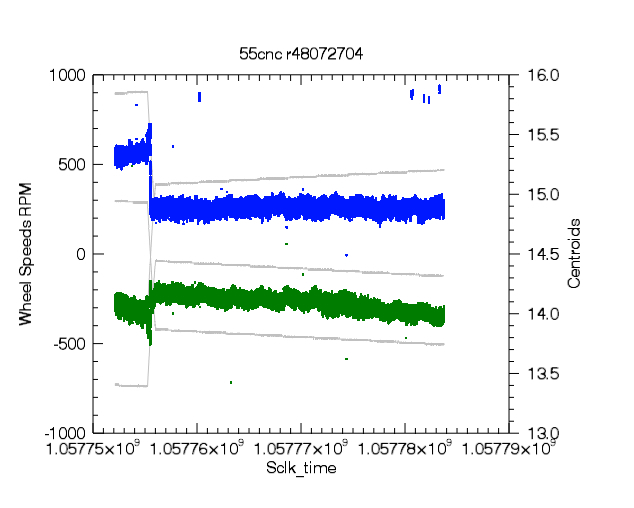
Jumps in position within AORs which do return to their original positions. During the summer 2013 anomaly, these jumps in position did not return to their original position. This behavior of not returning is confined to that anomaly.
Explanation:
The jumps in position correspond to wheel speed shifts. Wheel speed shifts are expected due to momentum rebalancing events in the wheel speed controller. The goal of this system is to avoid zero crossing disturbances (which would also induce position disturbances in the data) as long as possible. Autonomous momentum rebalancing only occurs when the system momentum grows above a certain threshold. Once this level is breached, the goal changes to balancing the wheels so that we can stretch out the time until the next desat. If the momentum falls back below that threshold, autonomous momentum rebalancing will once again be disabled.
We see different behavior during the PCS anomaly during the summer of 2013 because that anomaly was not allowing the momentum error integrator to compensate for the bearing drag in the wheels. A shift in wheel speed would introduce a different bearing drag torque, and without the integrator to compensate for this, the shift would not be removed.
These images can be used in analysis as long as the gain associated with the different centroids can be appropriately corrected for.

Figure 1: Wheel speed and centroid position as a function of time. This particular AOR shows a wheel speed shift with return to original position. Grey lines correspond to the wheel speeds in RPM (left Y axis). Spitzer has 4 wheels, all change simultaneously about 75% of the way through this observation. Blue and Green data correspond to the X and Y centroids of the target in the observation (right Y axis).

Figure 2: Same as Figure 1, except this AOR was during the 2013 anomaly. A wheel speed shift occurs at time 1.057755, but the centroids never return to their pre-wheel-shift positions.