IRAC High Precision Photometry
Noise pixel is a measure of the apparent size of the image. Specifically it is the equivalent number of pixels whose noise contributes to the flux of a point source. This quantity is useful as a parameter in removing the systematics of motion across a pixel over the course of a staring mode observation.
Summing over all pixels i, the intensity of each pixel is I(i), so that the noise pixel is the sum of the intensity squared divided by the sum of the squares of the intensity. The same measure can be split into its directional components, XFWHM and YFWHM.
noise pixels = sum(I(i))^2 / sum(I(i)^2)
xfwhm = 2 * sqrt(2 * alog(2)) * [sum(x(i)-x0)^2 * I(i)) / sum(I(i))]^0.5
yfwhm = 2 * sqrt(2 * alog(2)) * [sum(y(i)-y0)^2 * I(i)) / sum(I(i))]^0.5
These values do vary with size of the regions used to do aperture photometry . If you are using these values with the gain map dataset it is therefore imperative that you calculate Noise Pixel and XFWHM and YFWHM in the same way as box_centroider.pro. That code uses an aperture radius of 3 pixels and a background of [3,7] pixels. Preliminary indications are that using the pmap with X, Y, XYFWHM is not more effective than X, Y, NP.
Noise Pixel values range from 4 - 8 depending on location on the pixel, and which pixel the target falls on. There is no evidence that the PSF itself is changing.
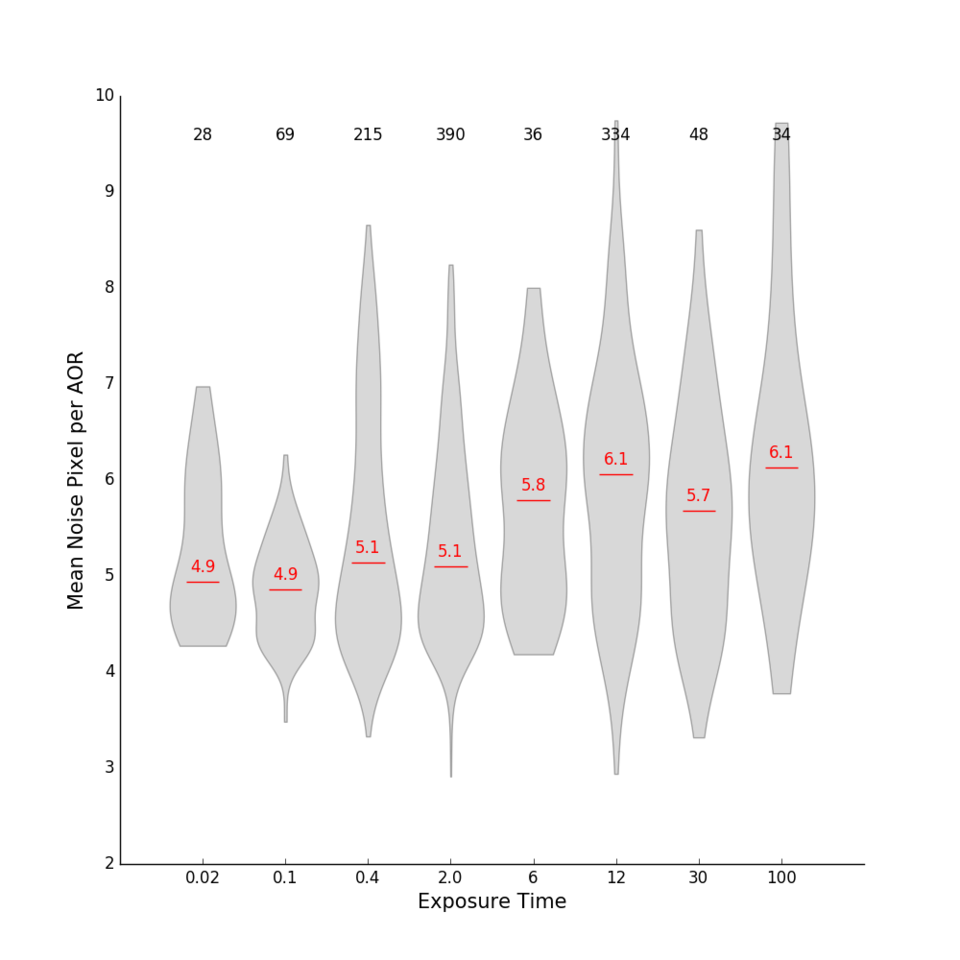
We do see evidence for noise pixel being correlated with exposure time (see Figure 1). Using all of the staring mode AORs in the warm mission archive through June 2017 (~1300 AORs), we see a statistically significant change in noise pixel with exposure time.
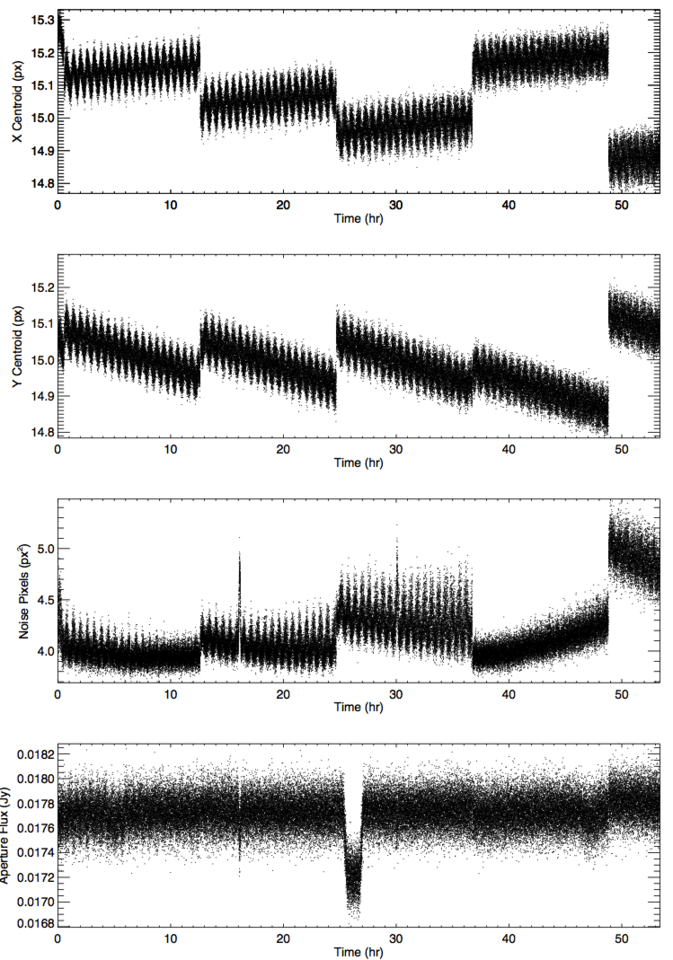
A few times over the course of the mission, noise pixel has been seen to sharply increase in value for a short duration (~30 min) before returning to normal (See Figure 2, 16&30 hours). See the Data Features page for a discussion of these Noise Pixel Spikes.
 Figure 1: Using all ~1300 staring mode AORs from the warm mission through June 2017, we plot the distribution of average noise pixel per AOR as a function of exposure time. Each of the gray shapes represents the distribution for the corresponding exposure time. Red lines show the median value per exposure time and are marked with that median noise pixel value. The total number of AORs per exposure time bin are printed at the top of the plot. We use sigma clipping to remove outliers, such as those that fell far away from the sweet spot.
Figure 2: X, Y, NP, and Flux values as a function of time over 5 simulated AORs. Note the noise pixel spikes at 16 and 30 hours which are seen in the noise pixel and flux plots, but not in the X & Y position plots. This simulated dataset is of WASP52 and was used for the data challenge presented at the 2014 Boston AAS workshop.