IRAC High Precision Photometry
From Ingalls et al. 2016, AJ, 152, 44, "Repeatability and Accuracy of Exoplanet Eclipse Depths Measured with Post Cryogenic Spitzer"
We examine the repeatability, reliability, and accuracy of differential exoplanet eclipse depth mea- surements made using the InfraRed Array Camera (IRAC) on the Spitzer Space Telescope during the post-cryogenic mission. We have re-analyzed an existing 4.5μm dataset, consisting of 10 observations of the XO-3b system during secondary eclipse, using seven different techniques for removing correlated noise. We find that, on average, for a given technique the eclipse depth estimate is repeatable from epoch to epoch to within 150 parts per million (ppm). Most techniques derive eclipse depths that do not vary by more than a factor 3 of the photon noise limit. All methods but one accurately assess their own errors: for these methods the individual measurement uncertainties are comparable to the scatter in eclipse depths over the 10-epoch sample. To assess the accuracy of the techniques as well as clarify the difference between instrumental and other sources of measurement error, we have also analyzed a simulated dataset of 10 visits to XO-3b, for which the eclipse depth is known. We find that three of the methods (BLISS mapping, Pixel Level Decorrelation, and Independent Component Analysis) obtain results that are within 3 times the photon limit of the true eclipse depth. When averaged over the 10-epoch ensemble, five out of seven techniques come within 100ppm of the true value. Spitzer exoplanet data, if measured following current best practices and reduced using methods such as those described here, can measure repeatable and accurate single eclipse depths, with close to photon-limited results.

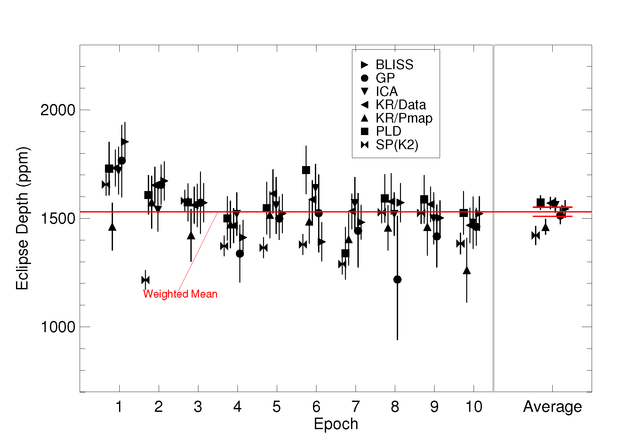
Eclipse depths for 10 visits to XO-3b, as computed via various methods. The group of points for each epoch is separated to minimize confusion. Error bars in this plot are symmetric; in cases where the technique returned asymmetric uncertainties, we used the largest of the two values. We show the results for the separate visits to the left of the gray vertical line, and the average results to the right. Error bars on the separate visits are the uncertainties reported by the technique. Error bars on the averages are the uncertainties in the weighted mean, adjusted for “underdispersion” using the scatter in the group of measurements. The horizontal red lines display the grand mean for all results, ± its uncertainty.

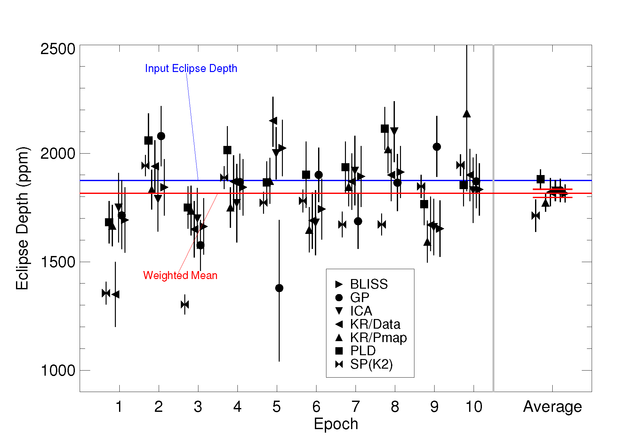
Eclipse depths for 10 simulated visits to XO-3b, as computed via various methods, similar to the above plot. A blue horizontal line indicates the eclipse depth input to the simulations, 1875 ppm.
For a full statistical description of the repeatability and accuracy of exoplanet measurements see: