IRAC High Precision Photometry
We examined the photometric stability of the IRAC detectors as a function of time over the course of the entire 11 year mission to date. This is relevant to high-precision time-series photometry in considering the use of the pixel phase gain map to correct datasets which were not taken contemporaneously with the gain map dataset. The data for the gain map itself were taken over the course of > 1 year, and will consequently also be effected by instabilities in photometry over year-long timescales.
We use the primary calibrators to examine photometric stability. The dataset consists of A and K stars, known to be stable at these wavelengths, observed roughly every two weeks throughout the mission. The figure below shows aperture photometry of seven calibration stars observed with a dither pattern in full array, binned together on two week timescales. Photometry is corrected for both the array location dependence and pixel phase effect using a double gaussian approximation to the pixel phase effect. Dithering to many positions and binning over all stars will reduce systematics from each of these effects. Each individual star is normalized to its median cryo level before being binned together with the other cal stars Error bars show the one sigma standard deviation on the mean divided by the square root of the number of data points in the bin. Cryo has more data points per bin, but a lower frequency of observations since the instrument was not always in use, accounting for the smaller cryo error bars.
As of Fall 2014, data from the end of cryo to about 9 months into warm has been processed with a different flux conversion value, and the fluxes are therefore offset for that time period. In Ch1 they are not even within the axis range plotted, which causes the gap in the plot at ~six years. The offset in normalized flux from cryo to warm is likely caused by the fact that flux conversions are determined from the entire dataset without regard to this measured slope. Taken as an ensemble, the cryo and warm flux conversions are designed to be consistent. The Ch2 dataset is noisier because the stars have lower signal to noise ratio (the same star is fainter in ch2 than ch1).
There is a statistically significant decrease in sensitivity of both ch1 and ch2 over the course of the mission. The deviation from zero change, a flat line fit to the data as a function of time, is tested using Monte Carlo techniques. We run 1000 instances of randomly shuffling the order of the times associated with each flux bin. The resulting distribution of measured slope is consistent with a gaussian distribution around zero slope, and is not consistent with the slopes measured here in the sense that >95% of the instances have slopes closer to zero than what the cal star data show. This is shown in the blue histogram for the ch2 warm datasets. The dashed line shows the measured slope.
Individual light curves for each of the calibration stars used in this analysis were checked to rule out the hypothesis that one or two of the stars varied in a way as to be the sole cause of the measured decrease in binned flux as a function of time. This is shown in the last figure below for the ch1 warm dataset, with each star represented by a different color. Slopes and their chi-squared fits as well as the star names are printed on the plot. While the slope for each individual star is not as well measured as for the ensemble of stars, it is apparent that the decreasing trend is seen in all/most stars, and is not caused by outliers.
One hypothesis as to the cause of the decrease in Flux over time is the decrease in CR hits over time due to the solar cycle. Green points show the CR counts taken from the 100s north ecliptic pole fields. Solar minimum occurs around the changeover between the cryo and warm missions. Solar maximum is around 2014, 11 years into the mission. CR counts should decrease as the solar activity increases because the solar activity pushes the volume of solar influence further out which decreases the number of CR which reach Spitzer. Since we see both CR counts increasing and decreasing over the mission, whereas the fluxes always decrease, the solar cycle cannot be the cause of the Flux decrease.
The decrease in sensitivity is potentially caused by radiation damage to the optics. The decrease in sensitivity is different for the two channels with the slope of the change being steeper for ch1.
What are the implications of this for science?
The degradation is of order 0.1% per year in ch1 and 0.05% per year in ch2. These levels are only relevant to high precision studies. Relative photometry studies will be immune to such changes since all photometry will change equally. Similarly, measurements of transit and eclipse depths will not change as function of time due to this effect because they are measured relative to the rest of the light curve.
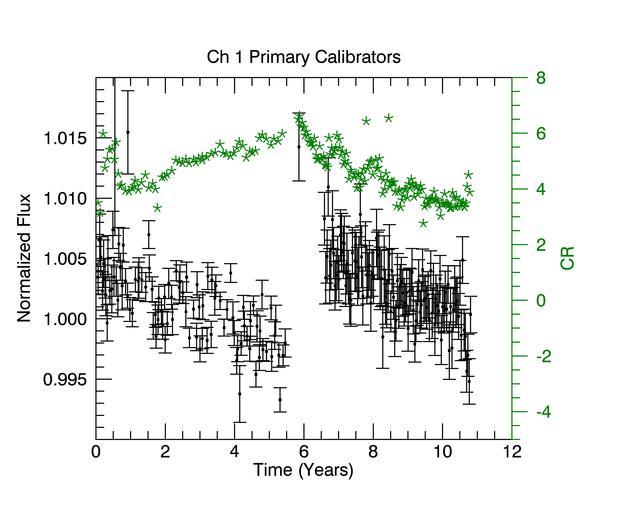

Figure 1: Ch1 and Ch2 ensemble of primary calibrator fluxes as a function of time since the start of the mission. Black points show the ensemble of primary calibrators while Green stars show the Cosmic Ray counts.

Figure 2: Individual calibration stars as a function of time. We see no evidence for a single outlier star as the source of the flux degradation trend.

Figure 3: A Monte Carlo simulation of what the slopes would be if the time stamps for each data point were shuffled using a Fisher-Yates shuffle. The actual measured slope for ch2 is shown with the dashed line. Because this measured slope is outside of 1 sigma, we take the slope to be significant.