IRAC High Precision Photometry
Datasets
Examples of known noise pixel spikes
| Planetname | AORkey | start_sclk | stop_sclk |
| HD7924 | r46981888 | 1041429073.301 | 1041455525.016 |
| HD7924 | r44605184 | 1004594183.339 | 1004622735.006 |
| XO3 | r46482944 | 1050530251.708 | 1050573212.475 |
| HD20003 | r48408064 | 1062587169.546 |
1062628187.337 |
Symptoms
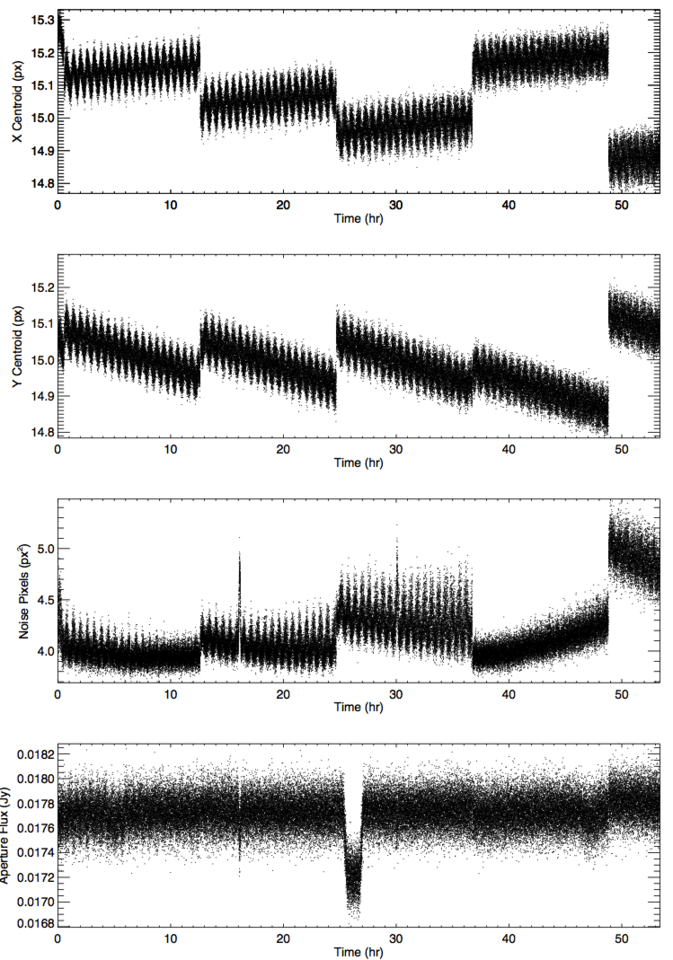
A few times over the course of the mission, noise pixel has been seen to sharply increase in value for a short duration (~30 min) before returning to normal (See Figure 1, 16&30 hours). These noise pixel spikes are alarming because as noise pixel goes up, the measured aperture flux will decrease which mimics the signal of a transit. During the spikes, positions don’t show out of the ordinary trends. There is also no apparent correlation with any particular spot on the pixel, so these are not related to a single position.
Explanation
Using the IRAC data simulator we have successfully replicated the noise pixel spikes seen in these datasets using a high frequency position oscillation. At frequencies higher than the observation rate, oscillations of the instrument will have the effect of smearing out the image, and thereby increasing noise pixel, without changing the object centroids (see Figure 2). A discussion of this was presented at the AAS workshop. Although we have looked for correlations with telemetry values, we do not yet know what could cause the suggested oscillations onboard Spitzer.

Simulated data including noise pixel spikes